Numerous people on the Internet got a lesson in geography thanks to a post on social media that questioned how maps were depicting the true size of the African continent. An account on X, formerly Twitter, known as Africa First, displayed a map showing the size of Africa being smaller than that of the distance between Eastern Europe and Asia, with the caption “Please explain it to me like I’m 5 years old.”
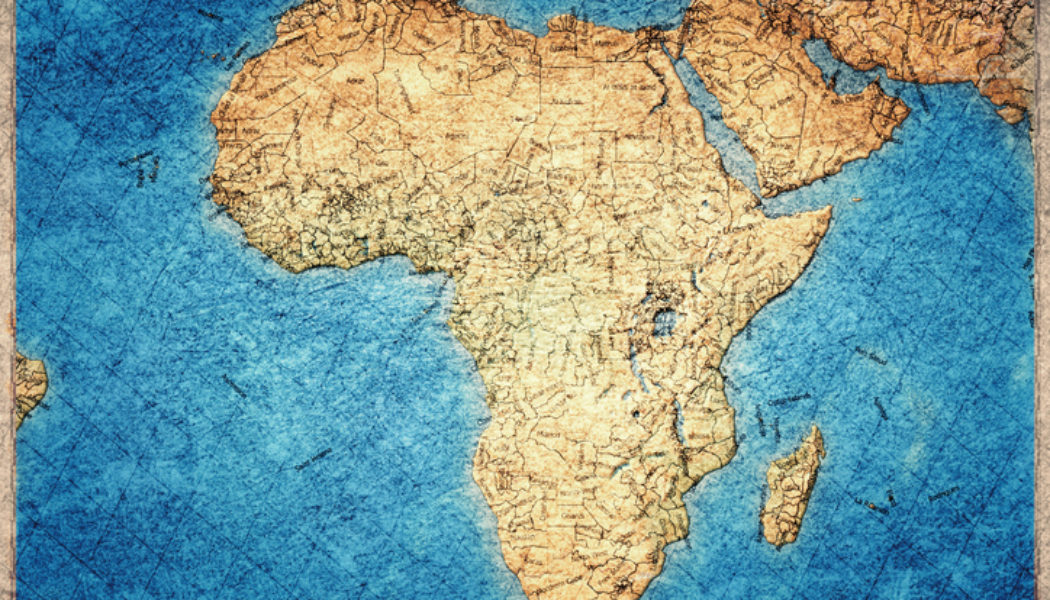
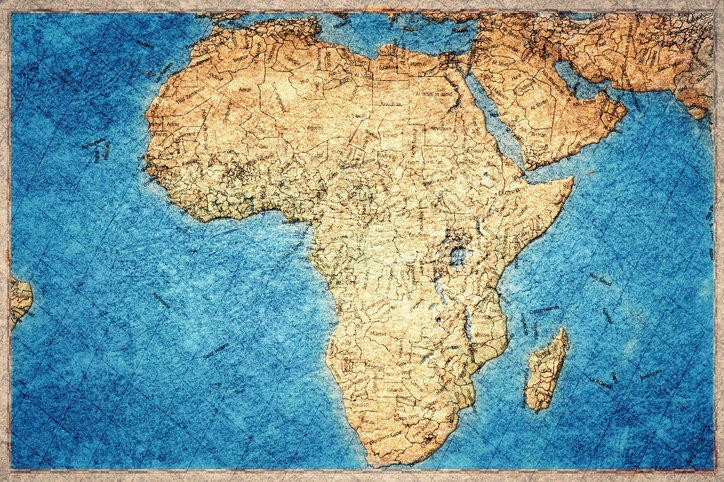
Africa is the world’s second-largest continent at 30.2 million square kilometers. (For comparison, the entirety of the United States is measured at 9.1 million square kilometers.) But the contemporary maps and all other previous ones stem from the Mercator projection, which was created in 1569 by the Flemish mapmaker Gerardus Mercator. It’s still a standard for charts on marine vessels, Web mapping services and a few occasional maps, but has seen less reliance on it particularly by Google Maps, which dropped its usage in zoomed-out areas in 2017.
The Mercator usage meant that areas closer to the poles like North America, Greenland and Europe would be sized up to be bigger the further away from the equator they are. The continent of Africa lies directly across the equator, adding to the distortion, making it smaller on charts that were originally laid flat for mariners to read.
The post concerning Africa’s true size garnered an array of reactions, with some calling for more honest representation of Africa on world maps. One user wrote, “Can we not make and create our own map that shows what the world actually looks like?” Another X user named Raphael’s Sai opined, “Based on the spread of Christianity,” pointing to these maps’ heavy usage during the era of colonialism.
Others took time to explain the history of the Mercator projections, showing the true sizes of nations and continents in a data-based map. An X user by the name of Angutyo provided several map projections answering the original post, writing:” Because you can never draw a 3D sphere on 2D surface at 100% accuracy.”