Bitcoin

Bitcoin fights key trendline near $20K as US dollar index hits new 20-year high
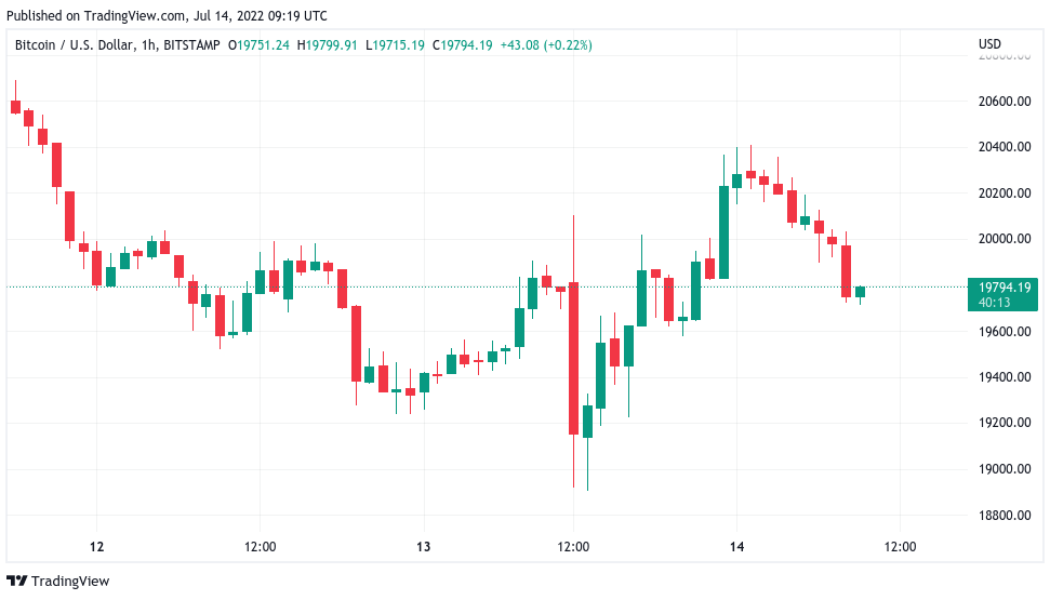
Bitcoin (BTC) found a new focus just under $20,000 on July 14 as U.S. dollar strength hammered out yet another two-decade high. BTC/USD 1-hour candle chart (Bitstamp). Source: TradingView DXY moves bring yen, euro into focus Data from Cointelegraph Markets Pro and TradingView showed BTC/USD rebounding from lows sparked by a fresh 40-year high for U.S. inflation as per the Consumer Price Index (CPI). After briefly dipping under $19,000, the pair took a flight above $20,000 before consolidating immediately below that psychologically significant level. For on-chain analytics resource Material Indicators, it was now “do or die” for BTC price action when it came to a key rising trendline in place since mid-June. On the day, that trendline stood at around $19,600, with BTC/USD n...

Price analysis 7/13: BTC, ETH, BNB, XRP, ADA, SOL, DOGE, DOT, SHIB, LEO
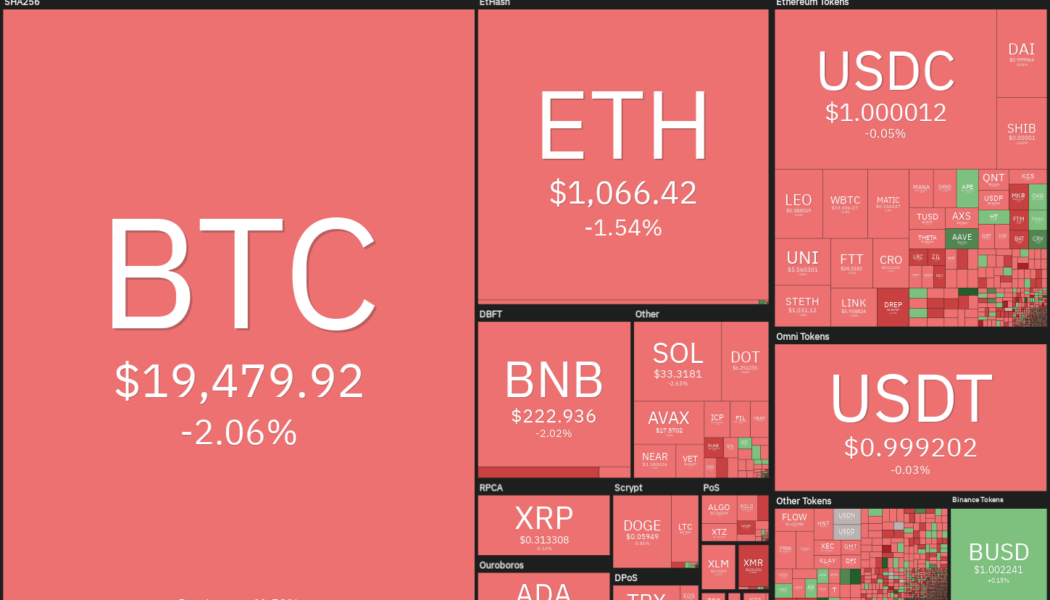
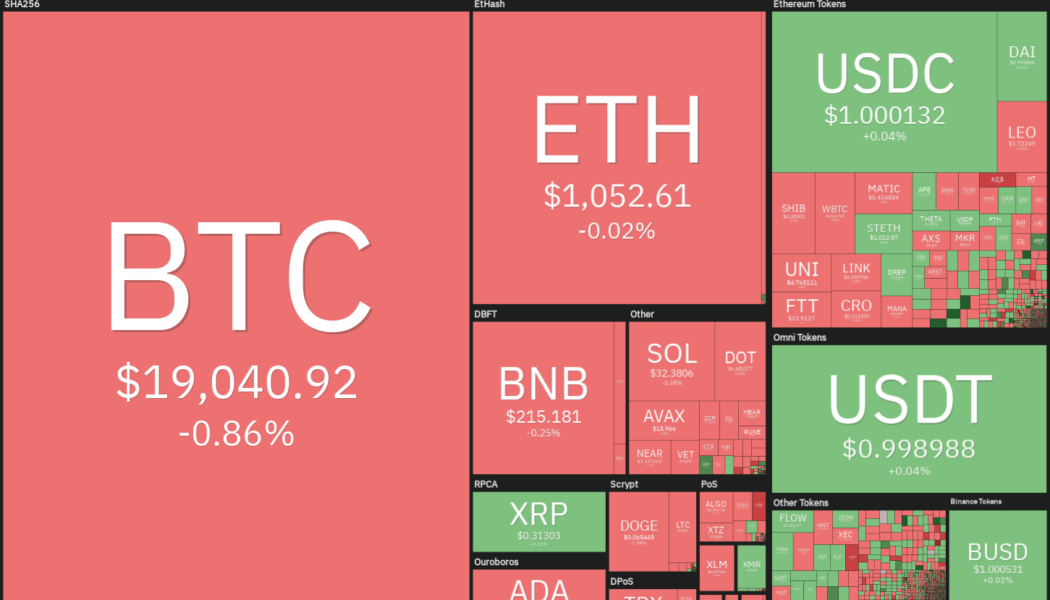
The United States Consumer Price Index soared to 9.1% in June, exceeding expectations of an 8.8% rise year-on-year. Currently, the Fed funds futures point to an 81 basis points rate hike for July, suggesting that some participants anticipate a 100 basis points hike. Several on-chain indicators have been pointing to a likely bottom in Bitcoin (BTC) but the analysts from market intelligence firm Glassnode are not convinced that the low has been made. In “The Week On-Chain” report on July 11, the analysts said that the market may have to fall further “to fully test investor resolve, and enable the market to establish a resilient bottom.” Daily cryptocurrency market performance. Source: Coin360 While the short term remains bearish, strategists are confident about its long-term prospects. ...
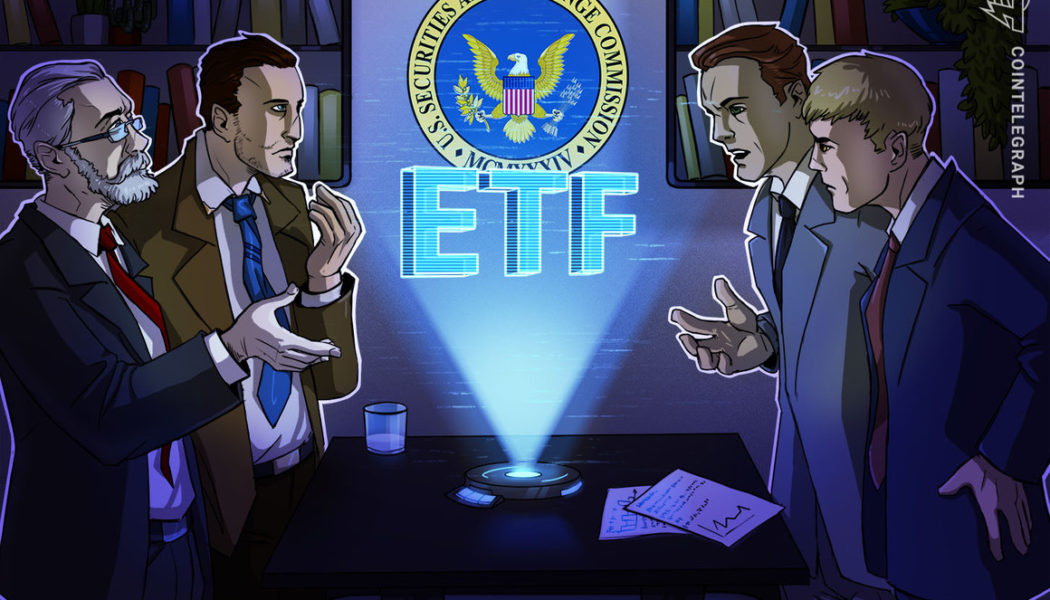

SEC extends window to decide on ARK 21Shares spot Bitcoin ETF to August
The United States Securities and Exchange Commission has pushed the deadline to approve or disapprove ARK 21Shares’ Bitcoin exchange-traded fund to August 30. According to a Tuesday filing from the SEC, the regulatory body extended the deadline for approving or disapproving the ARK 21Shares spot Bitcoin (BTC) ETF from July 16 for an additional 45 days, to August 30. The application, originally filed with the SEC in May and published for comment in the Federal Register on June 1, included a proposed rule change from the Chicago Board Options Exchange BZX Exchange. Ark Invest partnered with Europe-based ETF issuer 21Shares to file for a spot Bitcoin ETF listed on CBOE BZX Exchange in 2021, but the SEC rejected its application in April. Under current rules, the regulatory body is able to dela...
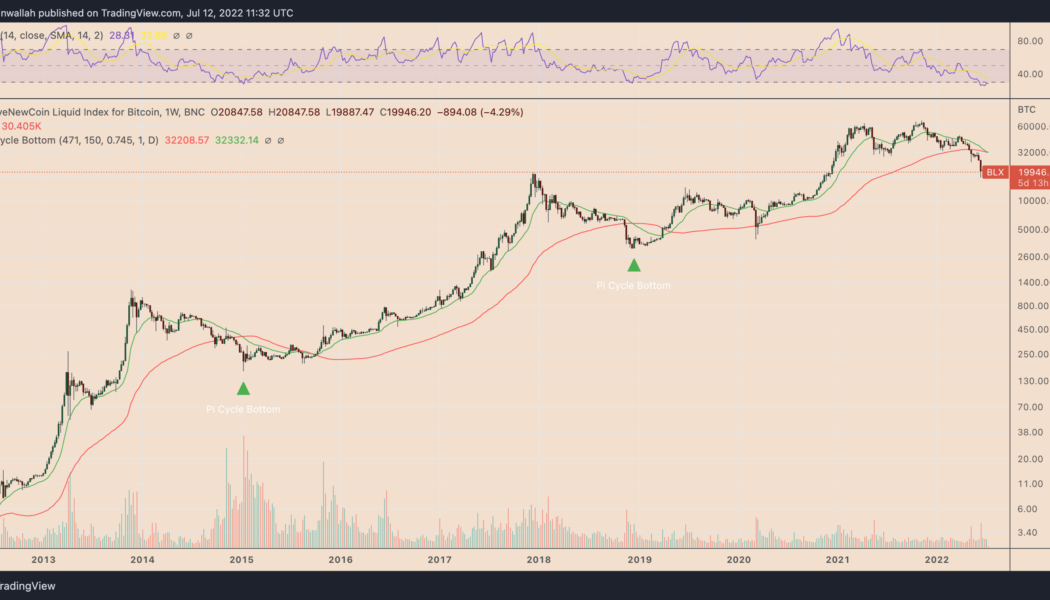

Bitcoin price indicator that marked 2015 and 2018 bottoms is flashing
Bitcoin (BTC) could undergo a massive price recovery in the coming months, based on an indicator that marked the 2015 and 2018 bear market bottoms. What’s the Bitcoin Pi Cycle bottom indicator? Dubbed “Pi Cycle bottom,” the indicator comprises a 471-day simple moving average (SMA) and a 150-period exponential moving average (EMA). Furthermore, the 471-day SMA is multiplied by 0.745; the outcome is pitted against the 150-day EMA to predict the underlying market’s bottom. Notably, each time the 150-period EMA has fallen below the 471-period SMA, it has marked the end of a Bitcoin bear market. For instance, in 2015, the crossover coincided with Bitcoin bottoming out near $160 in January 2015, followed by an almost 12,000% bull run toward $20,000 in December 2017....


Will Bitcoin’s Woes Only Get Worse?
We use cookies on our website to give you the most relevant experience by remembering your preferences and repeat visits. By clicking “Accept All”, you consent to the use of ALL the cookies. However, you may visit “Cookie Settings” to provide a controlled consent.


Price analysis 7/4: BTC, ETH, BNB, XRP, ADA, SOL, DOGE, DOT, LEO, SHIB
The crypto markets have remained relatively stable over the weekend and on July 4, which is a holiday for the United States financial markets due to Independence Day. Although Arthur Hayes, former CEO of derivatives platform BitMEX, was expecting a “mega crypto dump” around July 4, it has not materialized. The drop in Bitcoin’s (BTC) volatility in the past few days has resulted in the squeezing of the Bollinger Band’s width. This indicates a possible increase in volatility in the next few days, according to popular analyst Matthew Hyland. Daily cryptocurrency market performance. Source: Coin360 Meanwhile, crypto investors seem to be waiting for clues from the U.S. equities markets and the U.S. dollar. Bitcoin’s correlation coefficient with the dollar in the week ending July 3 slumped to 0....


Women could help drive Bitcoin to $250k, saysTim Draper
Crypto continues to see greater adoption around the world, with a major shift likely to come after the latest market downturn. Some of the upside impetus could actually be triggered from a group of market participants not currently a big part of the space – women. Survey reports have shown that women currently make up only a small percentage of investors in crypto. For instance, an CNBC survey in August last year revealed that male involvement in crypto was more than double that of women – 16% for men crypto compared to 7% for women. The gap is also pretty much the same in the Exchange-Traded Funds market, statistics showing a 14%:7% ration in favor of men. So, what happens if the crypto space saw increased adoption by women? According to venture capitalist Tim Draper, it would...

Top 5 cryptocurrencies to watch this week: BTC, SHIB, MATIC, ATOM, APE
The bears are attempting to sink Bitcoin (BTC) below $19,000 to further cement their advantage over the crypto market. Analysts watching Bitcoin’s MVRV-Z Score, a metric which measures how high or low Bitcoin’s price is relative to “fair value,” expect an even deeper fall before the bottom is finally reached. However, economist, trader and entrepreneur Alex Krueger pointed out that Bitcoin’s volume hit an all-time high in June. Usually, the highest volume in a downtrend is indicative of capitulation and that “creates major bottoms.” If Bitcoin follows the historical pattern of the 2018 bear market, Krueger expects the bottom to form in July. Crypto market data daily view. Source: Coin360 Due to the tight correlation between Bitcoin and the S&P 500, crypto traders will have to keep a cl...

What is a bull trap, and how to identify it?
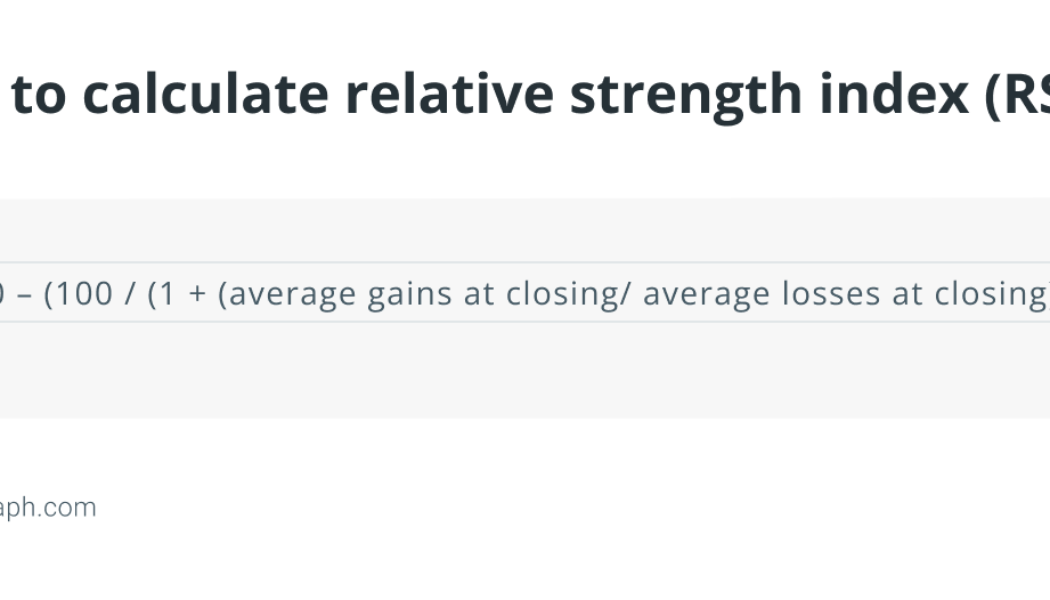
Here’s how to spot a bull trap with some tell-tale indicators that one is on the way: RSI divergence A high RSI might be an indication of a potential bull or bear trap. A relative strength index (RSI) calculation may be used to identify a possible bull or bear trap. The RSI is a technical indicator, which can help determine whether a stock or cryptocurrency asset is overbought, underbought or neither. The RSI follows this formula: The calculation generally covers 14-days, although it may also be applied to other timeframes. The period has no consequence in the calculation since it is removed in the formula. In the instance of a probable bull trap, a high RSI and overbought circumstances suggest that selling pressure is increasing. Traders are eager to pocket their gains and will ...
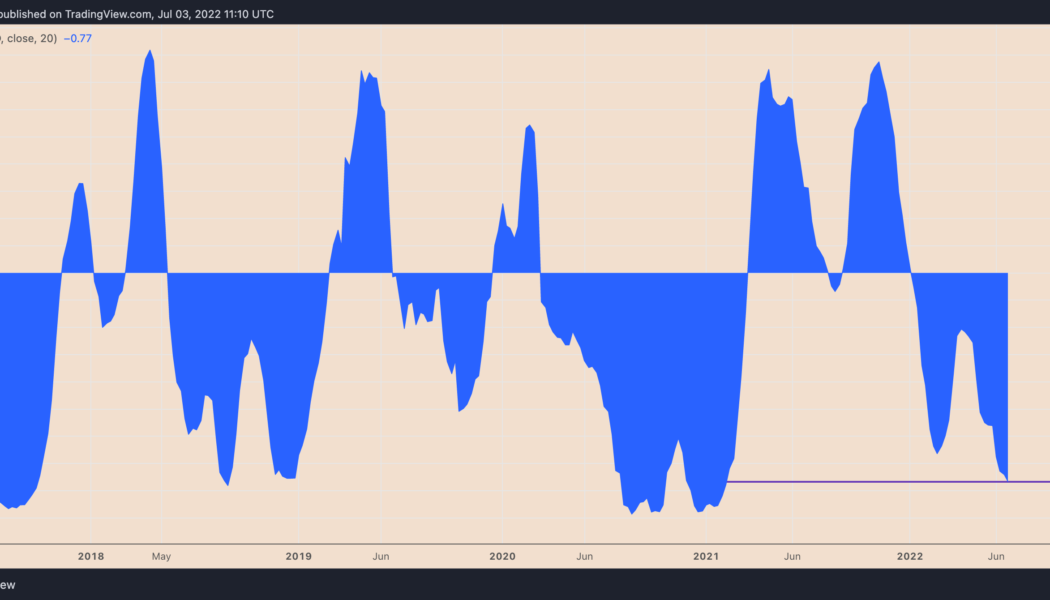

Bitcoin’s inverse correlation with US dollar hits 17-month highs — what’s next for BTC?
Bitcoin (BTC) has been moving in the opposite direction of the U.S. dollar since the beginning of 2022 — and now that inverse relationship is more extreme than ever. Bitcoin and the dollar go in opposite ways Notably, the weekly correlation coefficient between BTC and the dollar dropped to 0.77 below zero in the week ending July 3, its lowest in seventeen months. Meanwhile, Bitcoin’s correlation with the tech-heavy Nasdaq Composite reached 0.78 above zero in the same weekly session, data from TradingView shows. BTC/USD and U.S. dollar correlation coefficient. Source: TradingView That is primarily because of these markets’ year-to-date performances amid the fears of recession, led by the Federal Reserve’s benchmark rate hikes to curb rising inflation. Bitcoin, for example,...
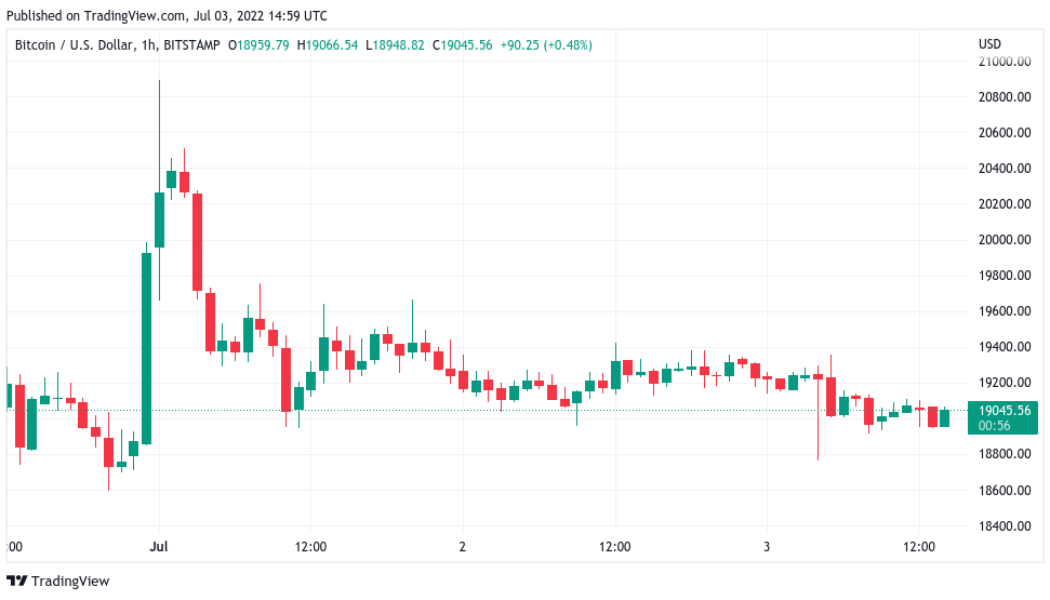

Bitcoin addresses in loss hit all-time high amid $18K BTC price target
Bitcoin (BTC) meandered into the weekly close on July 3 after weekend trading produced a brief wick below $18,800. BTC/USD 1-hour candle chart (Bitstamp). Source: TradingView Bollinger bands signal volatility due Data from Cointelegraph Markets Pro and TradingView followed BTC/USD as it stuck to $19,000 rigidly for a third day running. The pair had gone light on volatility overall at the weekend, but at the time of writing was still on track for the first weekly close below its prior halving cycle’s all-time high since December 2020. The previous weekend’s action had produced a late surge which saved bulls from a close below $20,000. Momentum remained weak throughout the following week’s Wall Street trading, however, and traders were unconvinced about the potential for a significant relief...