Bitcoin


What is an Iceberg order and how to use it?
An iceberg trade is most often executed by large institutional investors. Iceberg orders, also known as reverse orders, are mostly used by market makers, which is another word for an individual or firm who is providing offers and bids. When it comes to such big crypto transactions, we mostly talk about institutional crypto investors. They often trade in big amounts of cryptocurrencies, which may have a huge impact on the market. As a watcher, it’s possible to look up the order in the order books, but only a small part of the market maker iceberg orders is visible on level-2 order books. Level-2 order books, in the crypto world, contain all bids and asks on an exchange including price, volume and timestamp — real-time data collection it is. They call ...

Bitcoin price falls below $20K for first time since 2020, Ethereum dips under $1K
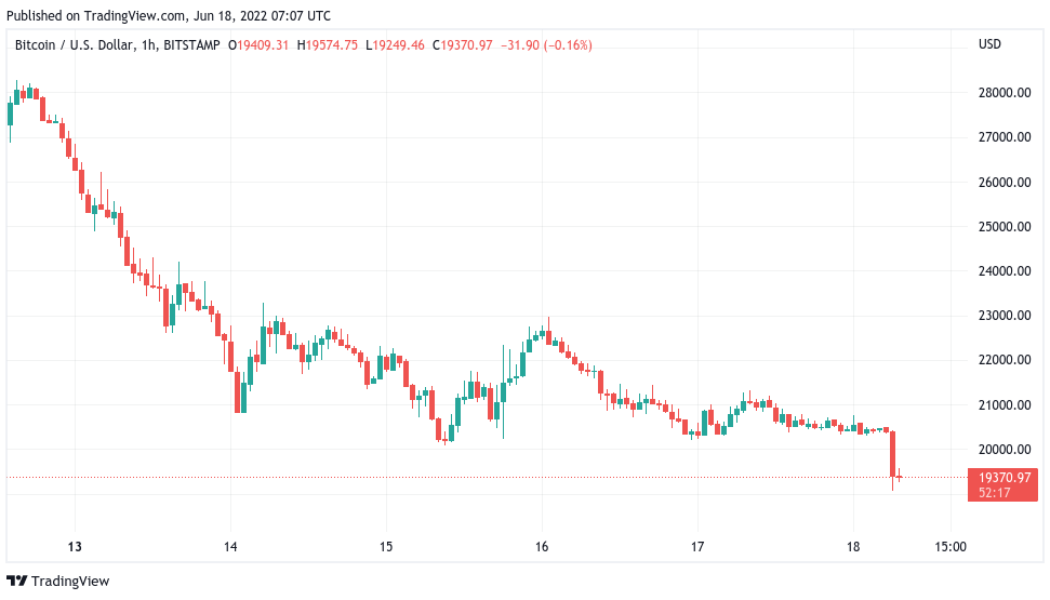
Bitcoin (BTC) achieved a bear market first on June 18 as BTC price action gave up $20,000 support. BTC/USD 1-hour candle chart (Bitstamp). Source: TradingView BTC price crosses under 2017 all-time high Data from Cointelegraph Markets Pro and TradingView confirmed BTC/USD sliding under $20,000 for the first time since December 2020, reaching press-time lows of $19,066. As nerves heightened after the United States Federal Reserve’s comments on the inflation outlook, crypto markets bore the brunt of a sell-off, which began after shock Consumer Price Index (CPI) figures last week. Losing the psychologically significant $20,000 mark, Bitcoin also achieved a lifetime first — dropping below its previous halving cycle’s high for the first time in its history. There’s a first...
Are Cryptocurrencies Set to Soar in Africa in 2022?
We use cookies on our website to give you the most relevant experience by remembering your preferences and repeat visits. By clicking “Accept All”, you consent to the use of ALL the cookies. However, you may visit “Cookie Settings” to provide a controlled consent.

BTC price rejects at $23K as US dollar declines from fresh 20-year highs
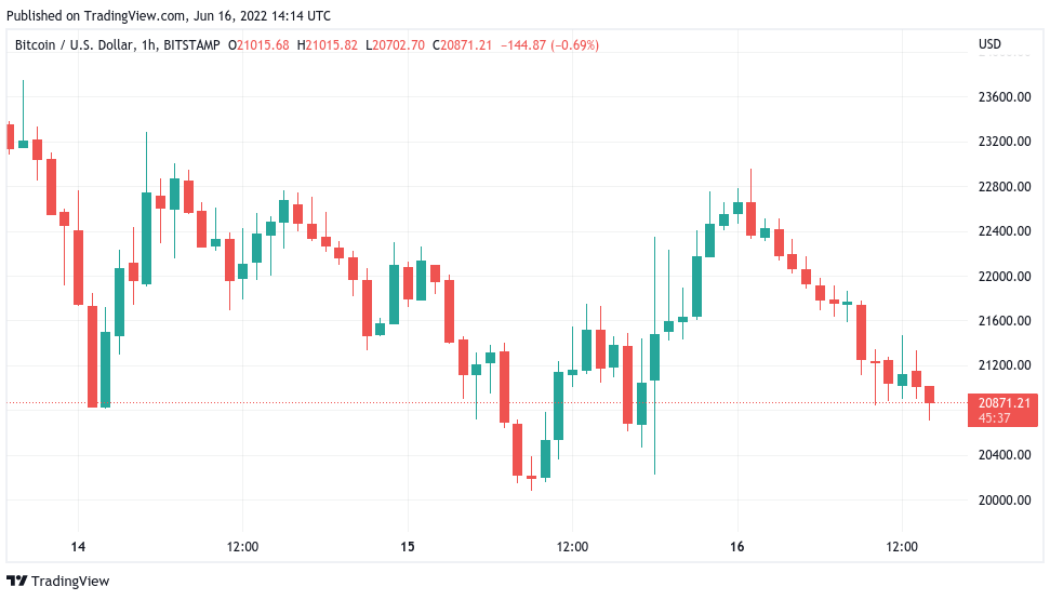
Bitcoin (BTC) ran out of steam near $23,000 on June 16 after the biggest United States key rate hike in nearly thirty years. BTC/USD 1-hour candle chart (Bitstamp). Source: TradingView Dollar strength wobbles after rate hike news Data from Cointelegraph Markets Pro and TradingView showed BTC/USD reaching highs of $22,957 on Bitstamp after the Federal Reserve confirmed a 0.75% hike in June — its largest since 1994. Momentum did not last long, however, and at the time of writing, the pair had shed $2,000 to return to $21,000 at the new Wall Street open. $BTC Did indeed fail to hold the mid range and fell back to the range low which it has held so far. This range low is my line in the sand if BTC doesn’t want to revisit the lows and possibly test sub $20K levels. Holding here and w...

Bitcoin bounces 8% from lows amid warning BTC price bottom ‘shouldn’t be like that’
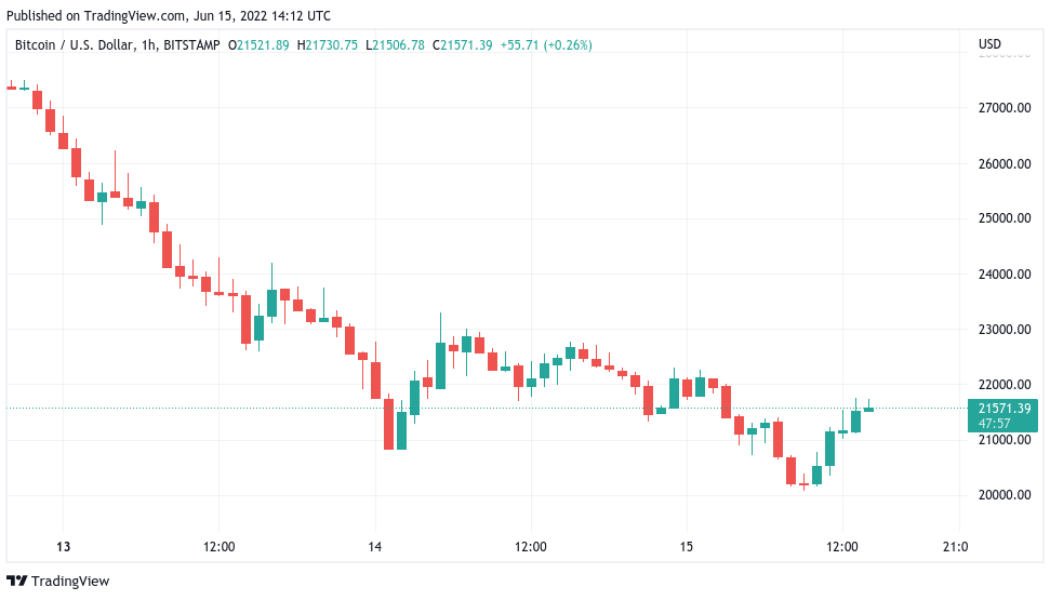
Bitcoin (BTC) spared hodlers the pain of losing $20,000 on June 15 after BTC/USD came dangerously close to last cycle’s high. BTC/USD 1-hour candle chart (Bitstamp). Source: TradingView Bitcoin “bottom” fools nobody Data from Cointelegraph Markets Pro and TradingView showed BTC/USD surging higher after reaching $20,079 on Bitstamp. In a pause from its sell-off, the pair followed United States equities higher on the Wall Street open, hitting $21,700. The S&P 500 gained 1.4% after the opening bell, while the Nasdaq Composite Index managed 1.6%. The renewed market strength, commentators said, was thanks to the majority already pricing in outsized key rate hikes by the Federal Reserve, due to be confirmed on the day. Nonetheless, it was crypto taking the worst hit in...

Biggest Bitcoin exchange inflows since 2018 put potential $20K bottom at risk
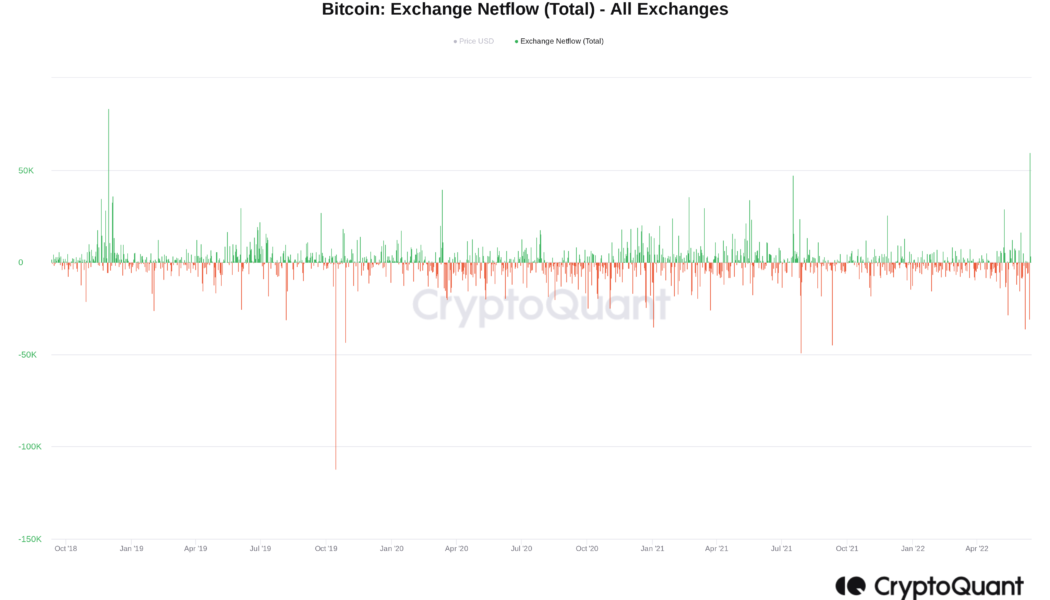
Bitcoin (BTC) could be on the verge of a retail major sell-off as exchange inflows spike to almost three-and-a-half-year highs. Data from on-chain analytics platform CryptoQuant shows users of 21 major exchanges sending coins to their wallets en masse on June 14. Major exchanges finish up 83,000 BTC in a single day As BTC/USD fell to lows of $20,800, panic appeared to set in among traders, and despite a reversal that at one point topped $23,000, few seemed willing to trust that the worst was over. Since then, spot price action has returned to near $21,000, while 24-hour exchange inflows reached 59,376 BTC. According to CryptoQuant data, this is the largest daily inflow since November 30, 2018. On that day, exchanges recorded 83,481 BTC of net inflows. May 9, 2022 ended with 29,082 BTC in n...

‘Too early’ to say Bitcoin price has reclaimed key bear market support — Analysis
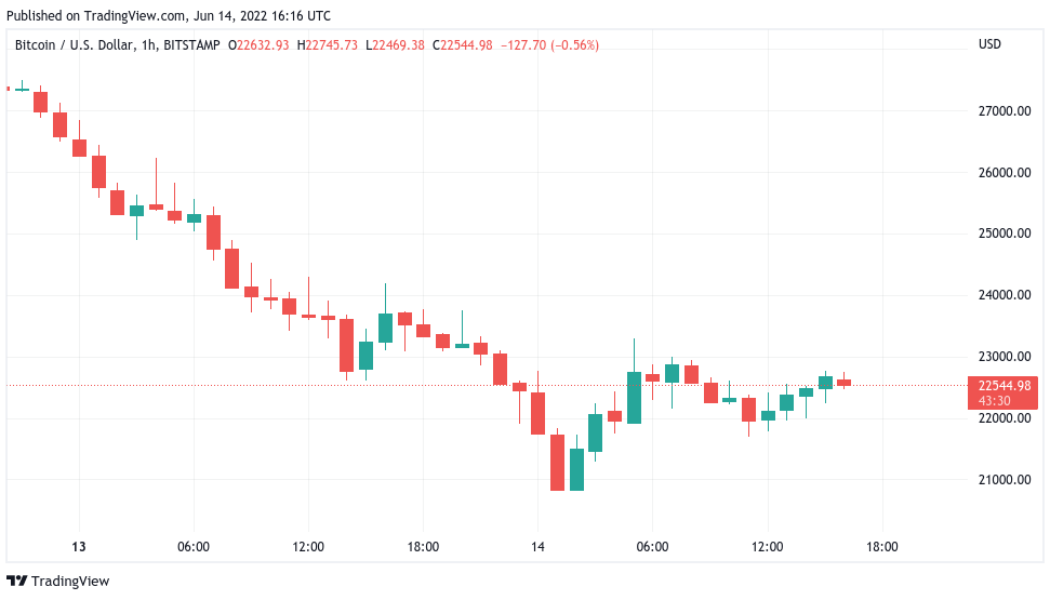
Bitcoin (BTC) crept higher after the June 14 Wall Street open as analysts hoped that long-term support had been preserved. BTC/USD 1-hour candle chart (Bitstamp). Source: TradingView Hopes for “relief” from FOMC meeting Data from Cointelegraph Markets Pro and TradingView followed BTC/USD as it traded above $22,500 at the time of writing, having hit local highs of $23,300 on the day. The pair had seen a strong bounce after nearing $20,800, with traditional markets likewise recovering after panic set in over United States inflation. Eyeing where Bitcoin could go next, on-chain analytics resource Material Indicators noted that the market had reclaimed the 200-day simple moving average (200 SMA), an important feature of Bitcoin bear markets that acted as support throughout pre...

BTC price crashes to $20.8K as ‘deadly’ candles liquidate $1.2 billion
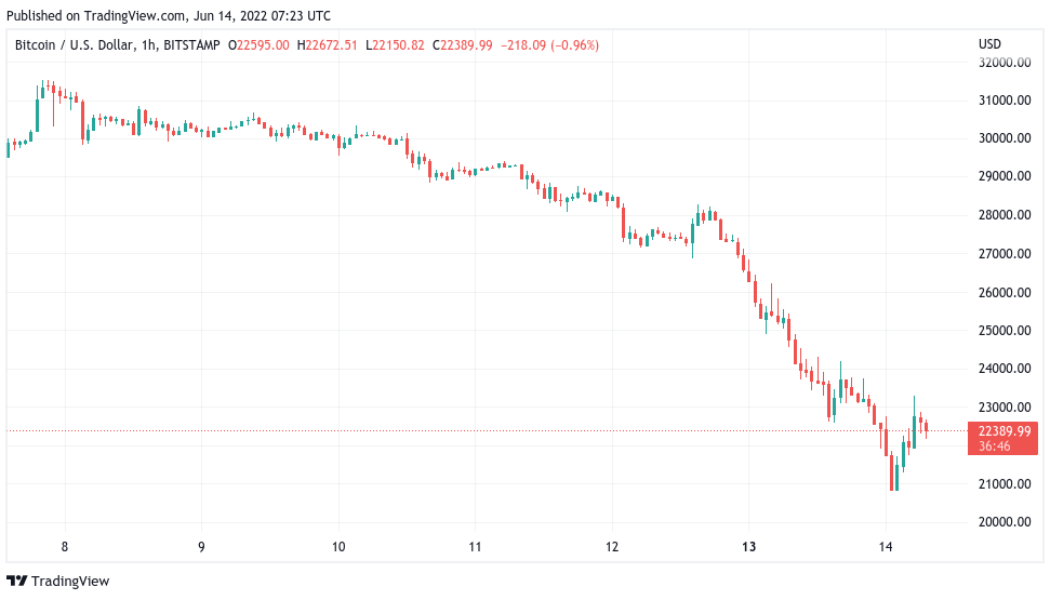
Bitcoin (BTC) came within $1,000 of its previous cycle all-time highs on June 14 as liquidations mounted across crypto markets. BTC/USD 1-hour candle chart (Bitstamp). Source: TradingView Bitcoin price hits 18-month lows Data from Cointelegraph Markets Pro and TradingView showed BTC/USD hitting $20,816, on Bitstamp, its lowest since the week of December 14, 2020. A sell-off that began before the weekend intensified after the June 13 Wall Street opening bell, with Bitcoin and altcoins falling in step with United States equities. The S&P 500 finished the day down 3.9%, while the Nasdaq Composite Index shed 4.7% ahead of key comments from the U.S. Federal Reserve on its anti-inflation policy. The worst of the rout was reserved for crypto, however, and with that, BTC/USD lost 22...
BTC price crashes to $20.8K as ‘deadly’ candles liquidate $1.2 billion
Bitcoin (BTC) came within $1,000 of its previous cycle all-time highs on June 14 as liquidations mounted across crypto markets. BTC/USD 1-hour candle chart (Bitstamp). Source: TradingView Bitcoin price hits 18-month lows Data from Cointelegraph Markets Pro and TradingView showed BTC/USD hitting $20,816, on Bitstamp, its lowest since the week of December 14, 2020. A sell-off that began before the weekend intensified after the June 13 Wall Street opening bell, with Bitcoin and altcoins falling in step with United States equities. The S&P 500 finished the day down 3.9%, while the Nasdaq Composite Index shed 4.7% ahead of key comments from the U.S. Federal Reserve on its anti-inflation policy. The worst of the rout was reserved for crypto, however, and with that, BTC/USD lost 22...

Almost $100M exits US crypto funds in anticipation of hawkish monetary policy
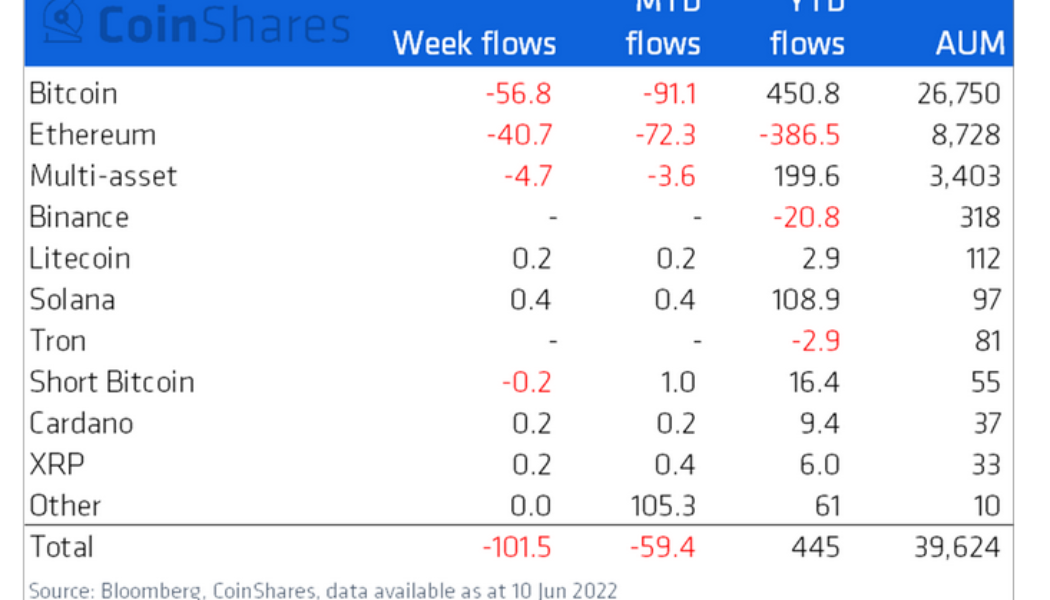
Institutional investors offloaded $101.5 million worth of digital asset products last week in ‘anticipation of hawkish monetary policy’ from the U.S. Federal Reserve according to CoinShares. U.S. inflation rates hit 8.6% year-on-year at the end of May, marking a return to levels not seen since 1981. As a result, the market is expecting the Fed to take considerable action to reel in inflation, with some traders pricing in three more 0.5% rate hikes by October. According to the latest edition of CoinShares’ weekly Digital Asset Fund Flows report, the outflows between June 6 and June 10 were primarily led by investors from the Americas at $98 million, while Europe accounted for just $2 million. Products offering exposure to crypto’s top two assets, Bitcoin (BTC) and Ethereum (ETH), accounted ...

Price analysis 6/13: BTC, ETH, BNB, ADA, XRP, SOL, DOGE, DOT, LEO, AVAX
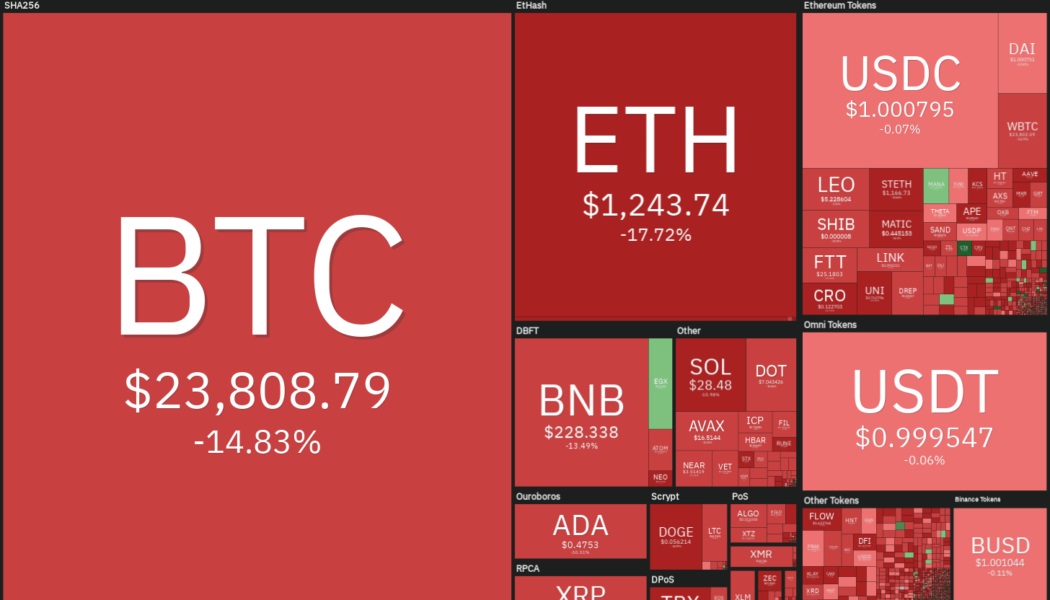
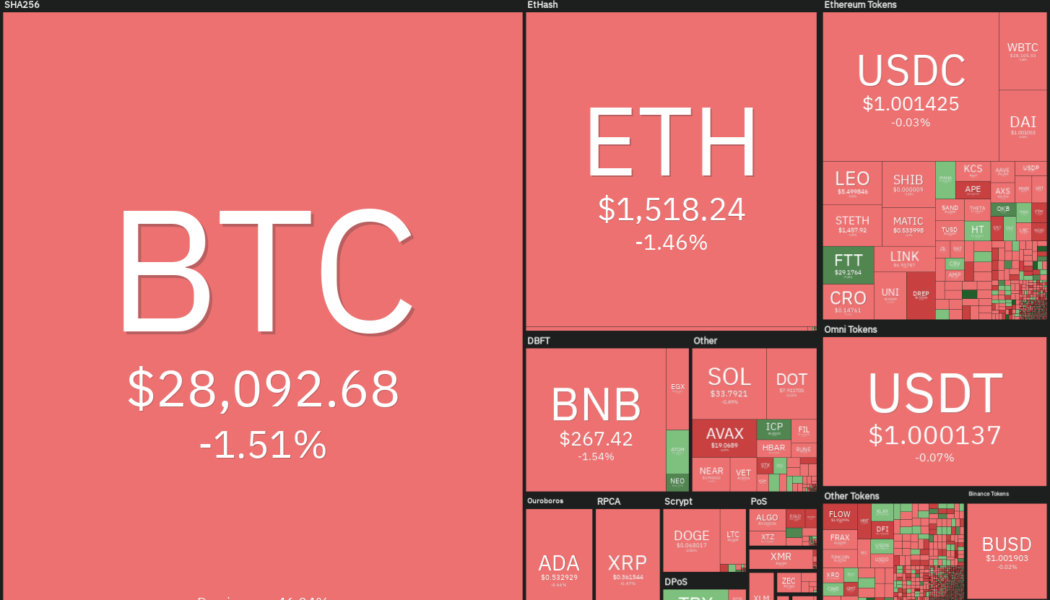
The United States equities markets extended their decline to start the week on June 13. The S&P 500 hit a new year-to-date low and dipped into bear market territory, falling more than 20% from its all-time high made on Jan. 4. The cryptocurrency markets are tracking the equities markets lower and the selling pressure further intensified due to the rumored liquidity crisis of major lending platform Celsius and traders possibly selling positions to meet margin calls. This pulled the total crypto market capitalization below $1 trillion. Daily cryptocurrency market performance. Source: Coin360 The sharp declines have led some analysts to project extremely bearish targets. While anything is possible in the markets and it is difficult to call a bottom, capitulations usually tend to sta...

Top 5 cryptocurrencies to watch this week: BTC, FTT, XTZ, KCS, HNT
Bitcoin (BTC) is threatening to drop to its worst weekly close since December of 2020. The crypto markets are in are held firmly in a vice grip and the selling accelerated following a higher-than-expected inflation report from the United States on June 10. It is not only the crypto markets that are facing the brunt, even U.S. equities markets finished the week ending June 10 with sharp losses. Risky assets may remain volatile in the near term as traders await the outcome of the U.S. Federal Open Market Committee meeting on June 14 and June 15. Crypto market data daily view. Source: Coin360 Bloomberg Intelligence senior commodities strategist Mike McGlone warned that if the stock markets continue to drop, then it will signal that most assets may have seen their peak exuberance in the ...