BTC Markets

On-chain data flashes Bitcoin buy signals, but the bottom could be under $20K
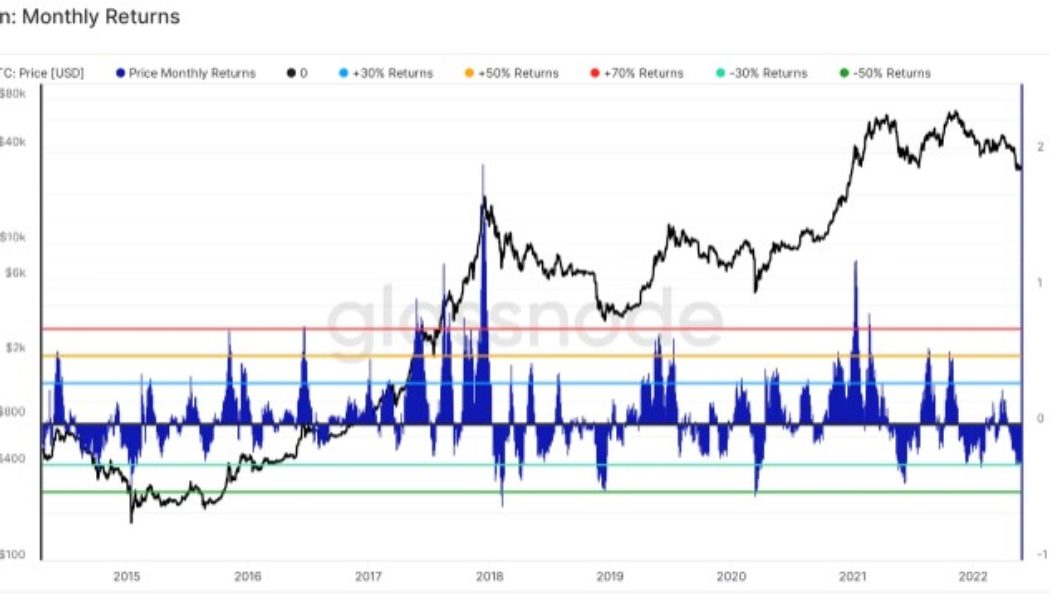
Every Bitcoin investor is searching for signals that the market is approaching a bottom, but the price action of this week suggests that we’re just not there yet. Evidence of this can be found by looking at the monthly return for Bitcoin (BTC), which was hit with a rapid decline that “translated to one of the biggest drawdowns in monthly returns for the asset class in its history,” according to the most recent Blockware Solutions Market Intelligence Newsletter. Bitcoin monthly returns. Source: Blockware Solutions Bitcoin continues to trade within an increasingly narrow trading range that is slowly being compressed to the downside as global economic strains mount. Whether the price continues to trend lower is a popular topic of debate among crypto analysts and the dominant opini...

3 metrics contrarian crypto investors use to know when to buy Bitcoin
Buying low and selling high is easier said than done, especially when emotion and volatile markets are thrown into the mix. Historically speaking, the best deals are to be found when there is “blood on the streets,” but the danger of catching a falling knife usually keeps most investors planted on the sidelines. The month of May has been especially challenging for crypto holders because Bitcoin (BTC) dropped to a low of $26,782, and some analysts are now predicting a sub-$20,000 BTC price in the near future. It’s times like these when fear is running rampant that the contrarian investor looks to establish positions in promising assets before the broader market comes to its senses. Here’s a look at several indicators that contrarian-minded investors can use to spot opportune moments for ope...

Falling wedge pattern points to eventual Ethereum price reversal, but traders expect more pain first
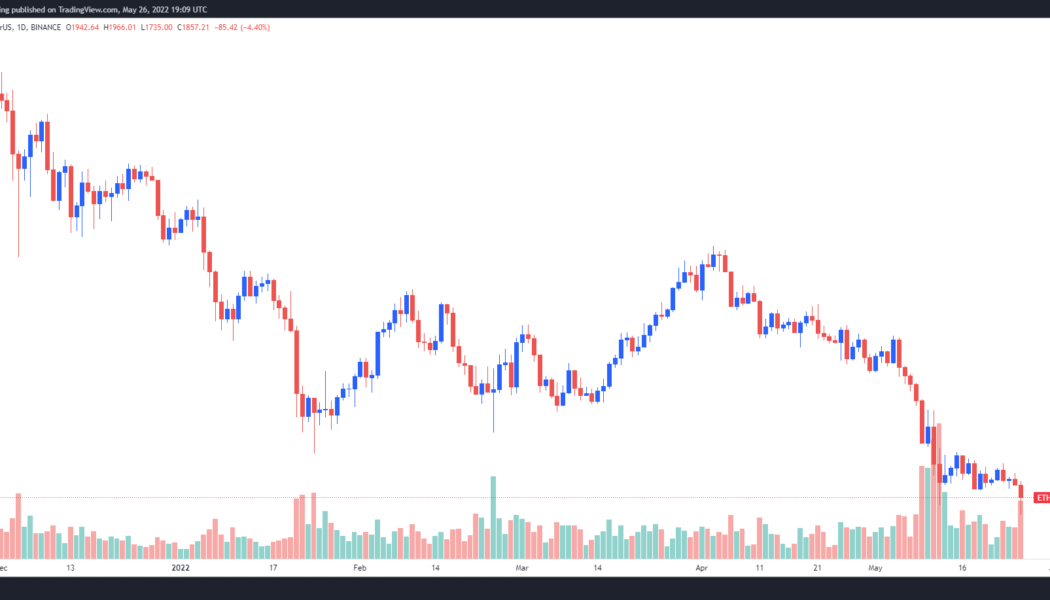
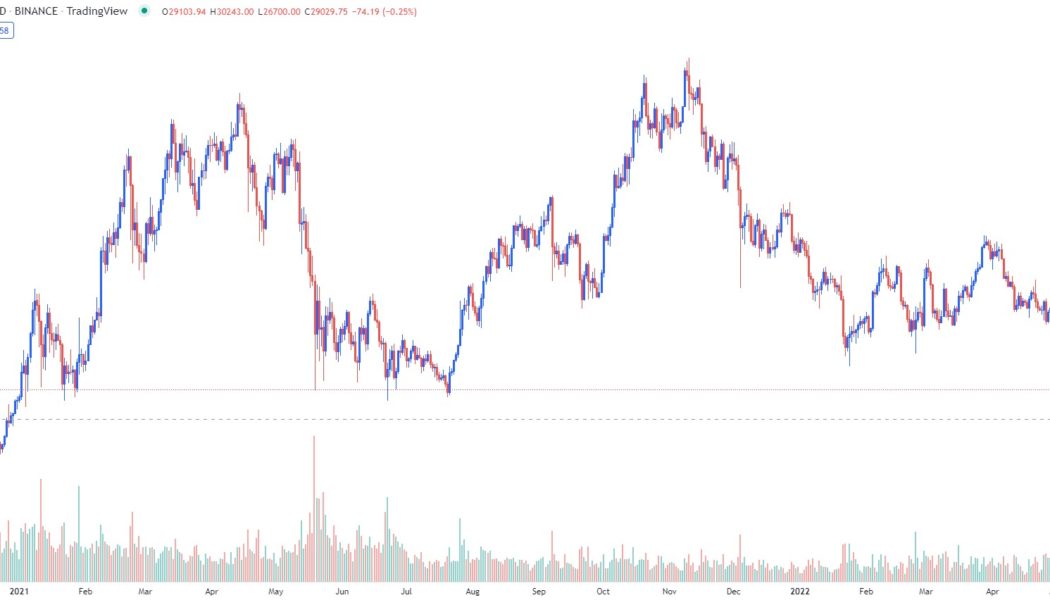
The cryptocurrency market was hit with another round of selling on May 26 as Bitcoin (BTC) price dropped to $28,000 and Ether (ETH) briefly fell under $1,800. The ETH/BTC pair also dropped below what traders deem to be an important ascending trendline, a move that traders say could result in Ether price correcting to new lows. ETH/USDT 1-day chart. Source: TradingView Here’s a rundown of what several analysts in the market are saying about the move lower for Ethereum and what it could mean for its price in the near term. Price consolidation will eventually result in a sharp move A brief check-in on what levels of support and resistance to keep an eye on was provided by independent market analyst Michaël van de Poppe, who posted the following chart showing Ether trading near its range ...

‘Extreme fear’ grips Bitcoin price, but analysts point to signs of a potential reversal
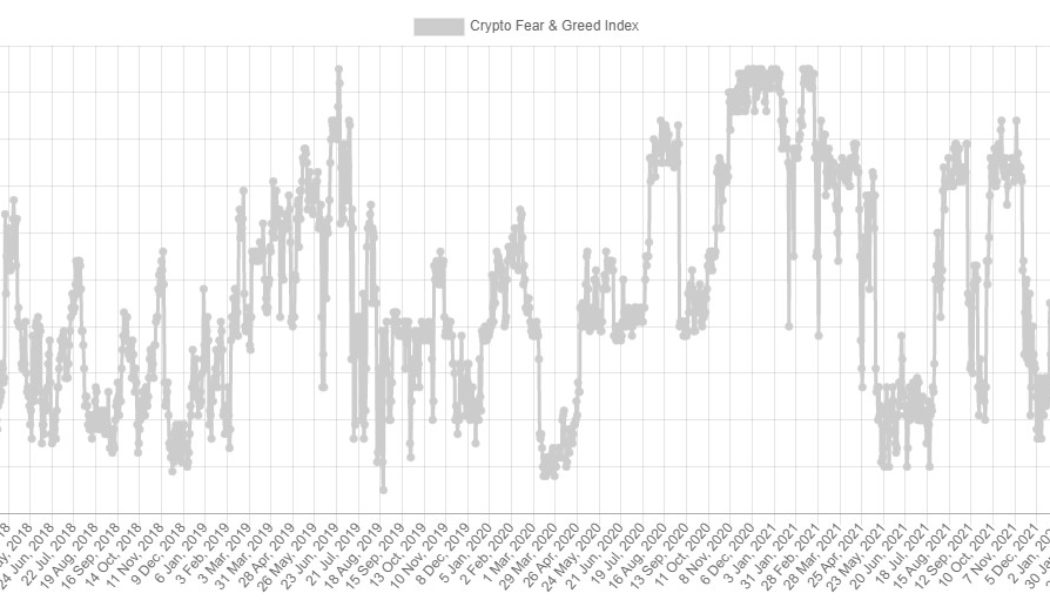
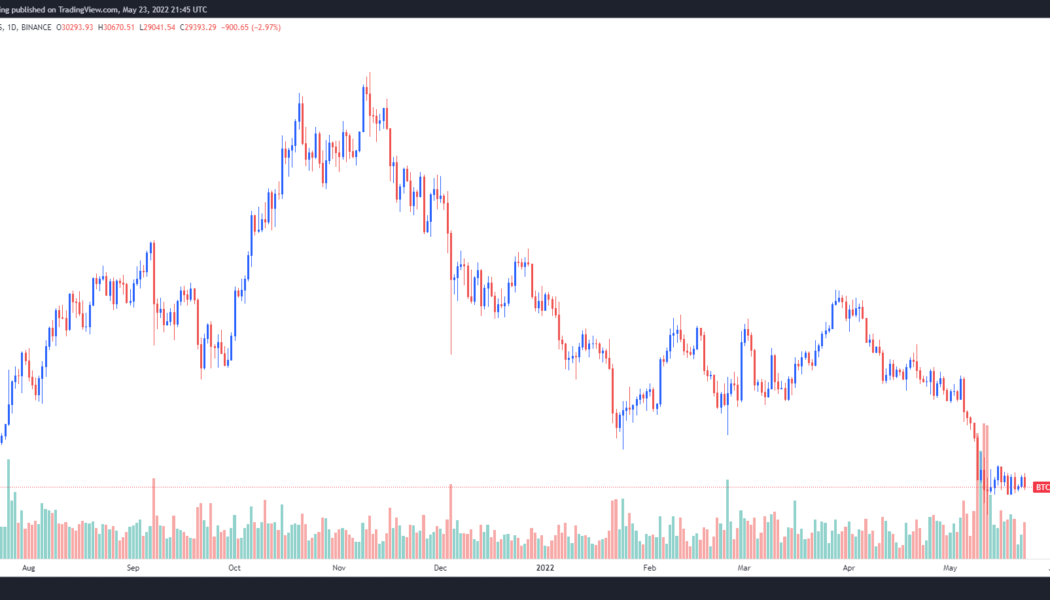
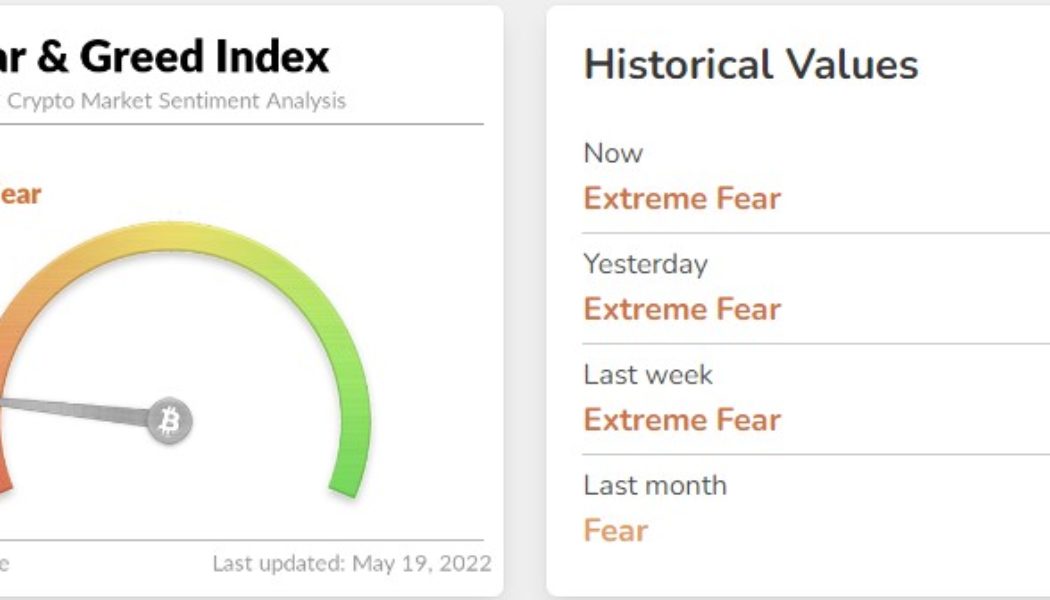
The cryptocurrency market settled into a holding pattern on May 25 after traders opted to sit on the sidelines ahead of the midday Federal Open Market Committee (FOMC) meeting where the Federal Reserve signaled that it intends to continue on its path of raising interest rates. According to data from Alternative.me, the Fear and Greed Index seeing its longest run of extreme fear since the market crash in Mach 2020. Crypto Fear & Greed Index. Source: Alternative Data from Cointelegraph Markets Pro and TradingView shows that the price action for Bitcoin (BTC) has continued to compress into an increasingly narrow trading range, but technical analysis indicators are not providing much insight on what direction a possible breakout could take. BTC/USDT 1-day chart. Source: TradingView Here’s ...

Crypto funds under management drop to a low not seen since July 2021
Digital asset investment products saw $141 million in outflows during the week ending on May 20, a move that reduced the total assets under management (AUM) by institutional funds down to $38 billion, the lowest level since July 2021. According to the latest edition of CoinShare’s weekly Digital Asset Fund Flows report, Bitcoin (BTC) was the primary focus of outflows after experiencing a decline of $154 million for the week. The removal of funds coincided with a choppy week of trading that saw the price of BTC oscillate between $28,600 and $31,430. BTC/USDT 1-day chart. Source: TradingView Despite the sizable outflow, the month-to-date BTC flow for May remain positive at $187.1 million, while the year-to-date figure stands at $307 million. On a more positive note, the multi-asset cat...

Contrarian Bitcoin investors identify buy zones even as extreme fear grips the market
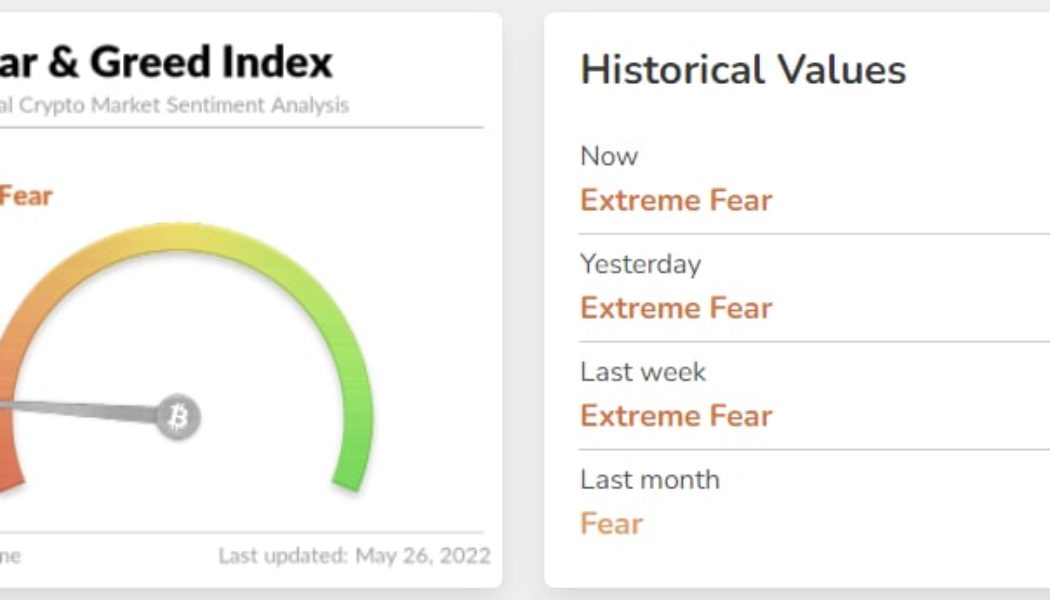
Bitcoin (BTC) support at the $30,000 level has proven to be quite resilient amidst the turmoil of the past two weeks with many tokens in the top 100 now showing signs of consolidation after prices bounced off their recent lows. Fear & Greed Index. Source: Alternative.me During high volatility and sell-offs, it’s difficult to take a contrarian view and traders might consider putting some distance from all the noise and negative news-flow to focus on their core convictions and reason for originally investing in Bitcoin. Several data points suggest that Bitcoin could be approaching a bottom which is expected to be followed by a lengthy period of consolidation. Let’s take a look at what experts are saying. BTC may have already reached “max pain” The spike in realize...

Bitcoin is discounted near its ‘realized’ price, but analysts say there’s room for deep downside
There are early signs of the “dust settling” in the crypto market now that investors believe that the worst of the Terra (LUNA) collapse looks to be over. Viewing Bitcoin’s chart indicates that while the fallout was widespread and quite devastating for altcoins, BItcoin (BTC) has actually held up fairly well. Even with the May 12 drop to $26,697 marking the lowest price level since 2020 multiple metrics suggest that the current levels could represent a good entry to BTC. BTC/USDT 1-day chart. Source: TradingView The pullback to this level is notable in that it was a retest of Bitcoin’s 200-week exponential moving average (EMA) at $26,990. According to cryptocurrency research firm Delphi Digital, this metric has historically “served as a key area for prior...

Bitcoin price could bounce to $35K, but analysts say don’t expect a ‘V-shaped recovery’
Altcoins saw a relief bounce on May 13 as the initial panic sparked by Bitcoin’s sell-off Terra’s UST collapse and multiple stablecoins losing their dollar peg begins to decrease and risk loving traders look to scoop up assets trading at yearly lows. Daily cryptocurrency market performance. Source: Coin360 Despite the significant correction that occurred over the past week, Bitcoin (BTC) bulls have managed to claw their way back to the $30,000 zone, a level which has been defended multiple times during the 2021 bull market. Here’s a look at what several analysts have to say about the outlook for Bitcoin moving forward as the price attempts to recover in the face of multiple headwinds. Is a short squeeze pending? Insight into the minds of derivatives traders was provided by ...

Buy the dip, or wait for max pain? Analysts debate whether Bitcoin price has bottomed
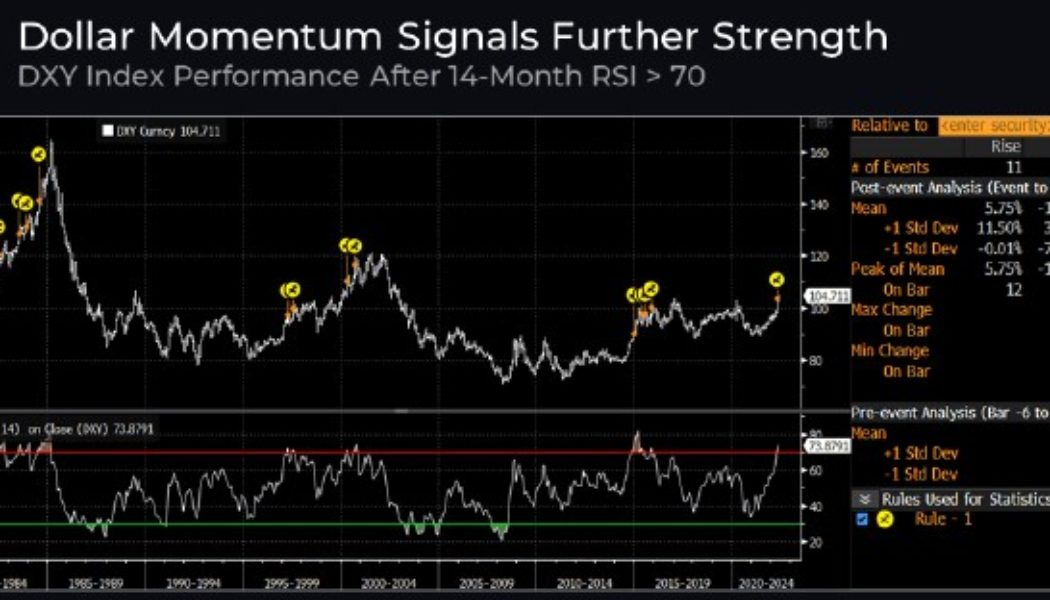
It has been a rough week for the cryptocurrency market, primarily because of the Terra ecosystem collapse and its knock-on effect on Bitcoin (BTC), Ethereum (ETH) and altcoin prices, plus the panic selling that took place after stablecoins lost their peg to the U.S. dollar. The bearish headwinds for the crypto market have been building since late 2021 as the U.S. dollar gained strength and the United States Federal Reserve hinted that it would raise interest rates throughout the year. According to a recent report from Delphi Digital, the 14-month RSI for the DXY has now “crossed above 70 for the first time since its late 2014 to 2016 run up.” DXY index performance. Source: Delphi Digital This is notable because 11 out of the 14 instances where this previously occurred “led to a strong...

Altcoins stage a relief rally while Bitcoin traders decide whether to buy the dip
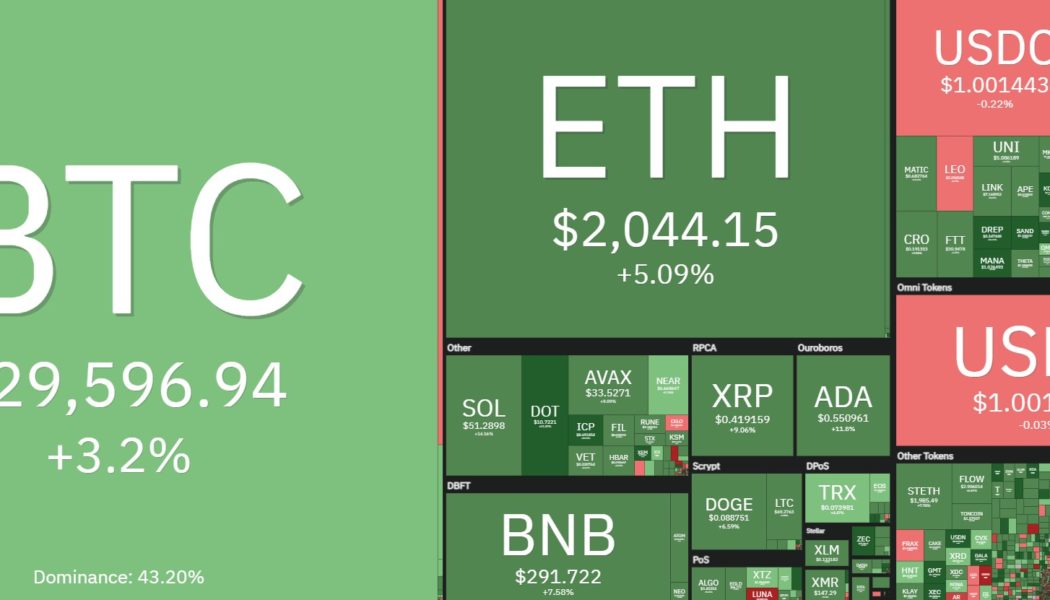
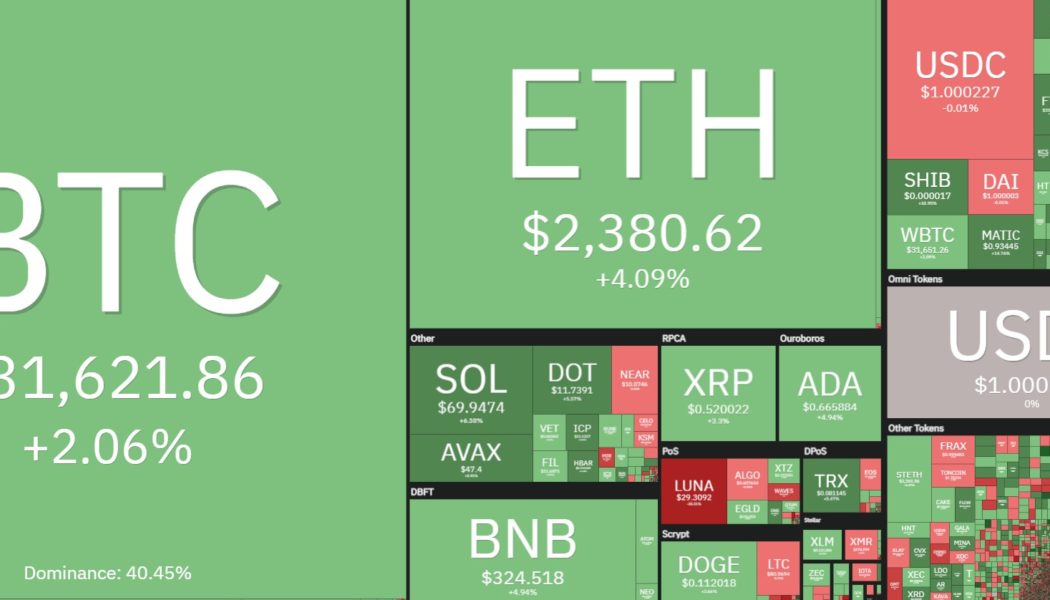
The similarity in price action between the crypto and traditional financial markets remains quite strong on May 10 as traders enjoyed a relief bounce across asset classes following the May 9 rout, which saw Bitcoin (BTC) briefly dip to $29,730. Market downturns typically translate to heavier losses in altcoins due to a variety of factors, including thinly traded assets and low liquidity, but this also translates into larger bounces once a recovery ensues. Daily cryptocurrency market performance. Source: Coin360 Several projects notched double-digit gains on May 10, including a 15.75% gain for Maker (MKR), the protocol responsible for issuing the DAI (DAI) stablecoin, which likely benefited from the fallout from Terra (LUNA) and its TerraUSD (UST) stablecoin. Other notable gainers incl...

Bitcoin retests key $30K support zone as data highlights BTC whale accumulation
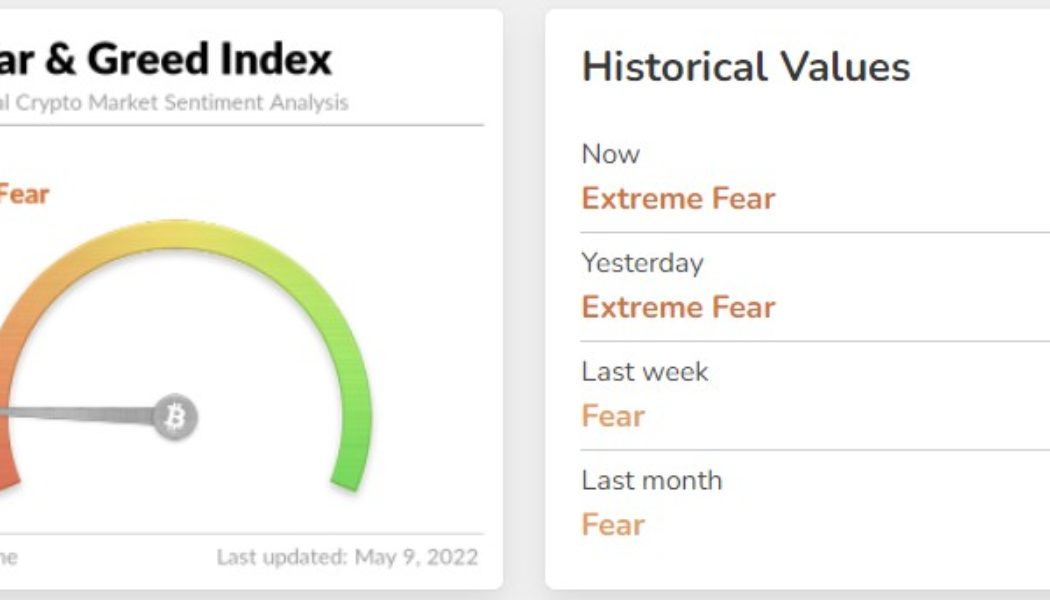
Sentiment across the cryptocurrency market plunged even deeper on May 9 as an escalation in the ongoing sell-off intensified with bears pushing Bitcoin (BTC) to $30,334, its lowest price since July 2021. Crypto Fear & Greed Index. Source: Alternative.me Multiple factors like rising interest rates, the end of easy money policies by the Federal Reserve, declining stock prices and concerns related to Terra’s UST stablecoin maintaining its $1 peg are all impacting sentiment within the crypto market. Data from Cointelegraph Markets Pro and TradingView shows that an afternoon of heavy selling on May 9 hammered the price of BTC to a daily low of $30,334 as bulls frantically regrouped to defend the psychologically important $30,000 price level. BTC/USDT 1-day chart. Source: TradingView H...

Bitcoin price falls to $31K as traders prepare for a ‘rocky’ road and more downside
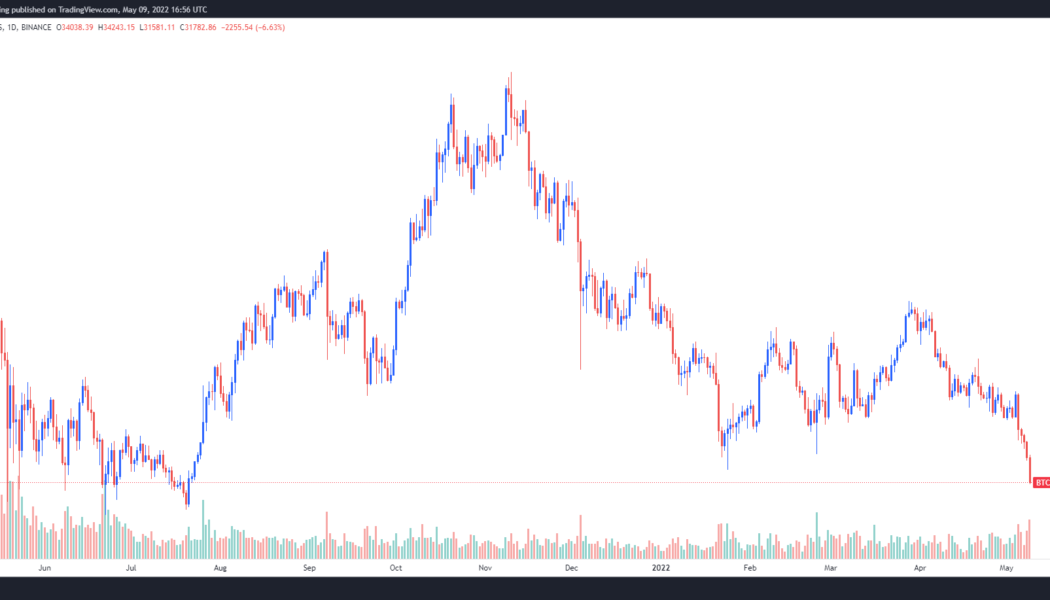
“When it rains, it pours” is an old saying finding new relevance in the cryptocurrency markets on May 9 as traders face another day of pain and the current price decline brings Bitcoin (BTC) to its lowest level in 2022. Data from Cointelegraph Markets Pro and TradingView shows that the BTC selloff on May 9 intensified as the trading day progressed with Bitcoin hitting a daily low of $31,000 as bulls scrambled to mount what amounted to a weak defense. BTC/USDT 1-day chart. Source: TradingView Here’s a look at some of the developments that led up to May 9’s price declines and what traders can look for as the crypto market heads deeper into bear territory. Further downside is a possibility Bitcoin bulls have struggled to establish a solid floor of support over the past couple of m...