BTC price

Bitcoin price bounces after Amazon stock gains 15% in US tech comeback
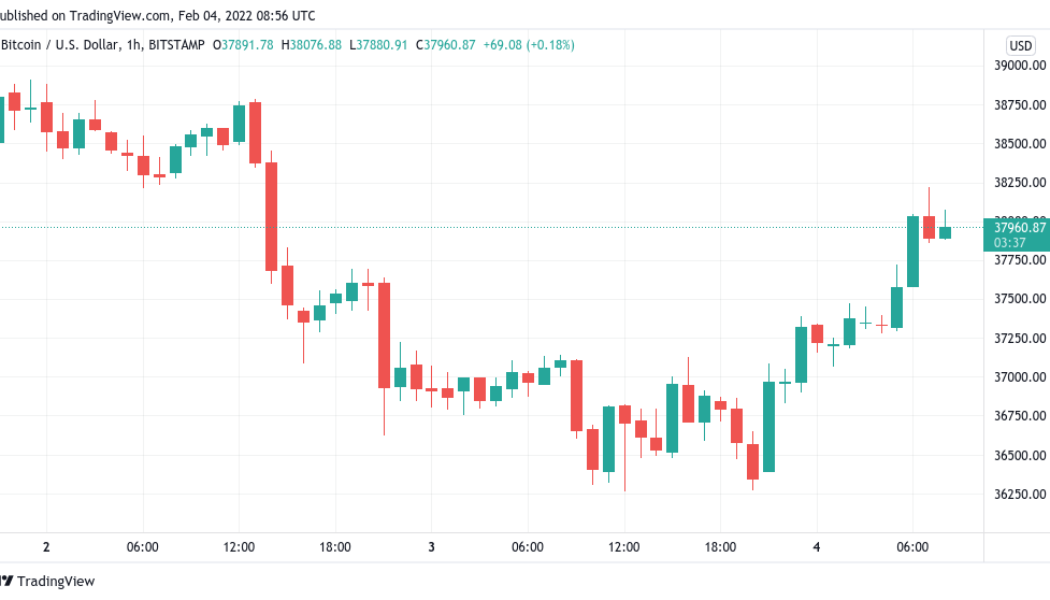
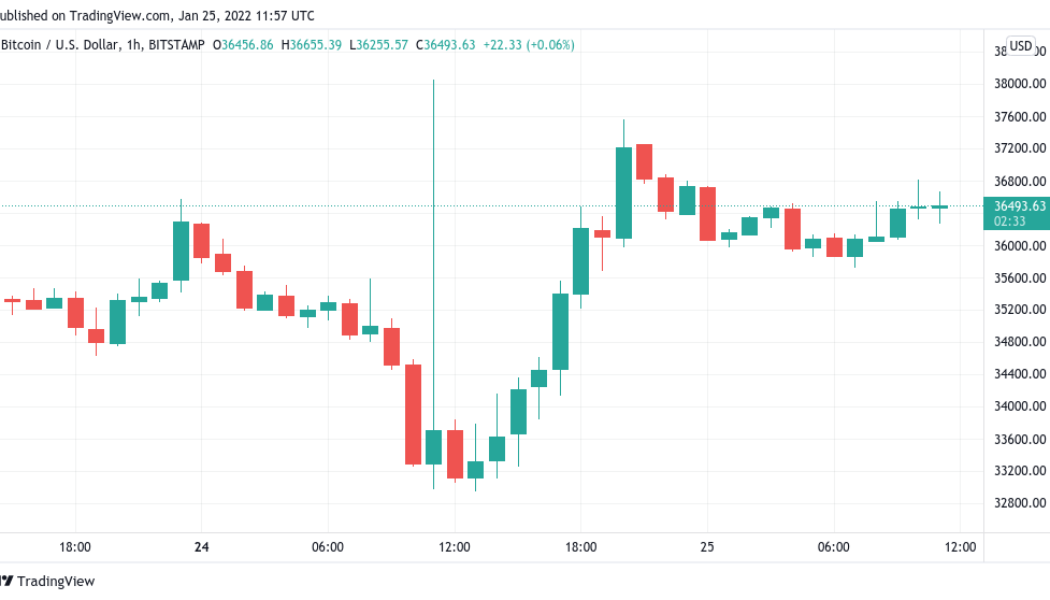
Bitcoin (BTC) recovered much of its recent losses on Feb. 4, but concerns remained that a retest of $30,000 was incoming. BTC/USD 1-hour candle chart (Bitstamp). Source: TradingView $38,600 remains focal pivot Data from Cointelegraph Markets Pro and TradingView showed BTC/USD returning to $38,000 Friday, up over 2% in 24 hours. The pair saw a strong comeback overnight after suffering at the hands of United States stock sellers for two days straight. A similar turnaround for tech stocks later on Thursday, with Amazon gaining 15%, set the stage for Bitcoin to rise in step, with BTC proponents nonetheless criticizing the over volatility of some equities. The rebound, meanwhile, could go some way to averting a deeper retracement for Bitcoin, this nonetheless favored by Cointelegraph contributo...

The US Federal Reserve is making some analysts bullish on Bitcoin again
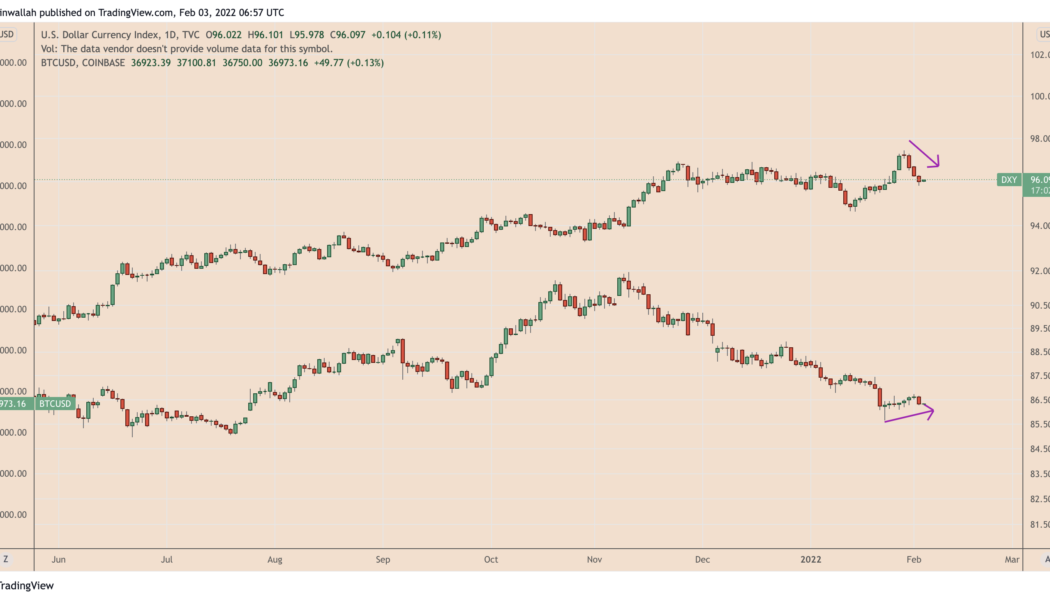
Signs of a steady Bitcoin (BTC) price recovery emerged earlier this week as investors shifted away from the U.S. dollar on weaker-than-expected economic data. In detail, Bitcoin’s drop last week to below $33,000 met with a healthy buying sentiment that pushed its per token rate to as high as $39,300 on Feb. 1. As of Thursday, BTC’s price dipped below $37,000 but was still up 13% from its local bottom. Meanwhile, the U.S. dollar index (DXY), which measures the greenback’s strength against a basket of top foreign currencies, rose to 97.441 last Friday, logging its best level since July 2020. However, the index corrected by nearly 1.50% to over 96.00 by Feb. 3. DXY vs. BTC/USD daily price chart. Source: TradingView Some market analysts saw the dollar’s renewed weakness...

Bitcoin bounces at $36.6K as Meta adds 20% losses to US tech stock rout
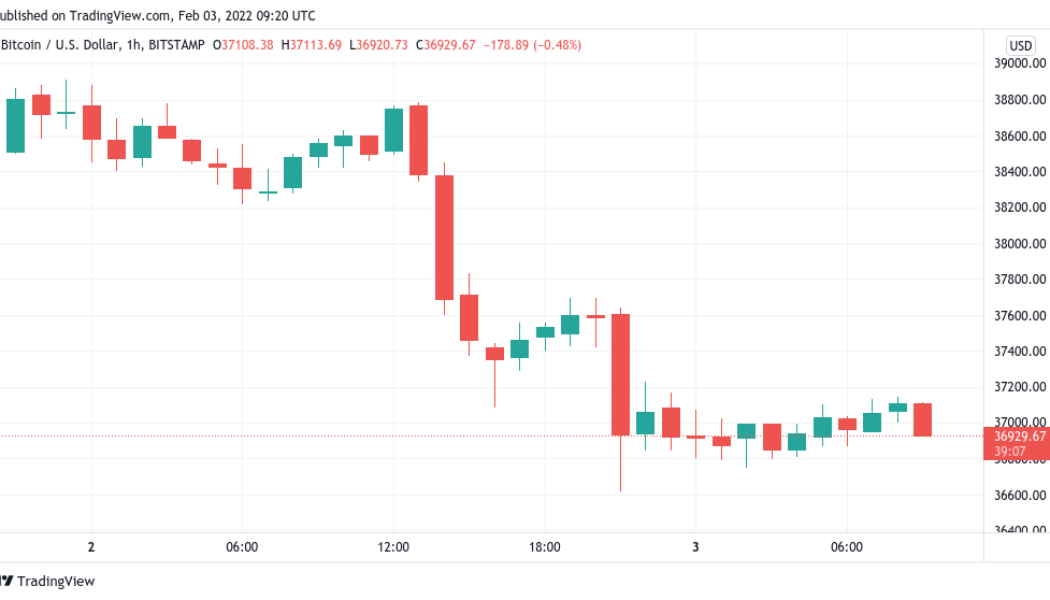
Bitcoin (BTC) recovered above $37,000 on Feb. 3 after a stocks rout took the wind out of bulls’ latest attempt to crack $40,000 resistance. BTC/USD 1-hour candle chart (Bitstamp). Source: TradingView “Extraordinary moves” for stocks Data from Cointelegraph Markets Pro and TradingView showed BTC/USD staying lower after briefly hitting $36,650 on Bitstamp Wednesday. The weakness followed shock losses for U.S. equities at the Wall Street open on Wednesday, with major names such as PayPal shedding huge portions of their value after underwhelming performance reports. Major stocks have been experiencing extraordinary moves post earnings after hours this season Netflix -22%Apple +7%Google +11%Paypal -20%Facebook -22%Spotify -23% Liquidity and the Fed’s put are both go...

BTC price faces crucial trend battle as Bitcoin RSI confirms breakout
Bitcoin (BTC) may have stopped short of $40,000, but this week’s gains have helped spark a more significant breakout for underlying price strength. BTC/USD 1-hour candle chart (Bitstamp). Source: TradingView RSI breaks a two-month tradition Data from Cointelegraph Markets Pro and TradingView shows that sustained BTC price action above $37,000 this week has allowed the relative strength index (RSI) to diverge from a multi-month downtrend. After going from $36,700 to $39,280 in February, Bitcoin still lacks the momentum needed to challenge $40,000 resistance. That could soon change, however, as one trader shows that RSI has now exited its dive deep into “oversold” territory. RSI looks at how “oversold” or “overbought” an asset is at a given price point. As Cointelegraph reported, since ...

‘No signs Bitcoin has bottomed’ as data warns BTC price downtrend continuing
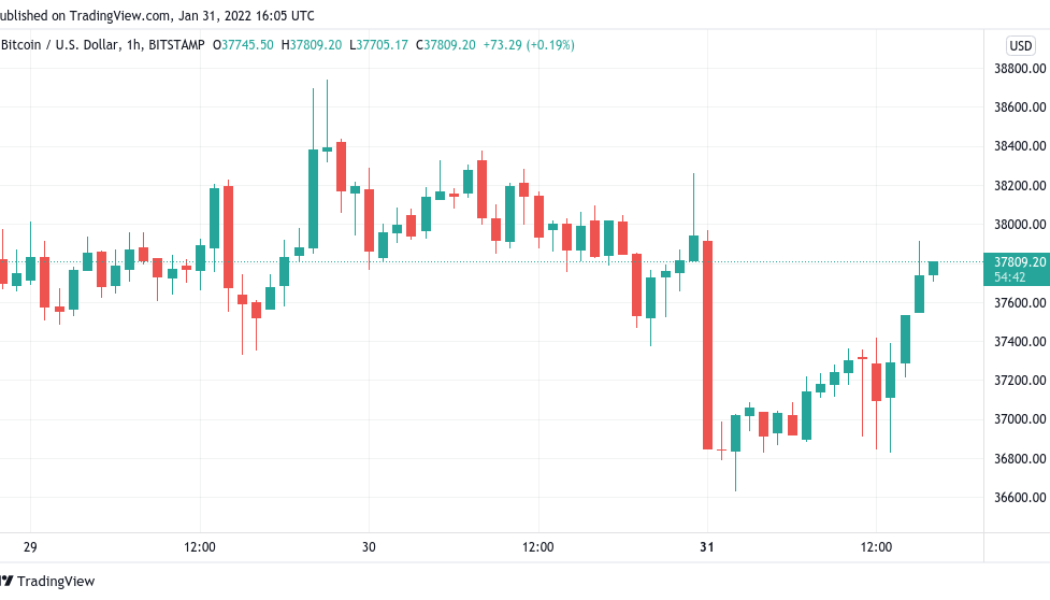
Bitcoin (BTC) received a welcome boost at the Wall Street open on Jan. 31 as fresh research painted a gloomy picture for near-term price action. BTC/USD 1-month candle chart (Bitstamp). Source: TradingView Trader “not interested” in longs below $38,500 Data from Cointelegraph Markets Pro and TradingView showed BTC/USD climbing toward $38,000 on Monday, reversing a correction which set in immediately after Sunday’s weekly close. With stocks giving some relief to bulls, many analysts remained hands-off on Bitcoin while higher levels nearer $40,000 remained unchallenged. “Bitcoin chopping around and fighting resistance, while the volume remains low overall,” Cointelegraph contributor Michaël van de Poppe summarized after his latest YouTube update. “As ...

US crypto executive order looms — 5 things to watch in Bitcoin this week
Bitcoin (BTC) starts a new week with a bang — but not in the right direction for bulls. A promising weekend nonetheless saw BTC/USD attract warnings over spurious “out of hours” price moves, and these ultimately proved timely as the weekly close sent the pair down over $1,000. At $37,900, even that close was not enough to satisfy analysts’ demands, and the all-too-familiar rangebound behavior Bitcoin has exhibited throughout January thus continues. The question for many, then, is what will change the status quo. Amid a lack of any genuine spot market recovery despite solid on-chain data, it may be an external trigger that ends up responsible for a shake-up. The United States’ executive order on cryptocurrency regulation is due at some point in February, for ex...

Bitcoin stays near $38K as RSI breakout challenges ‘boring’ weekend
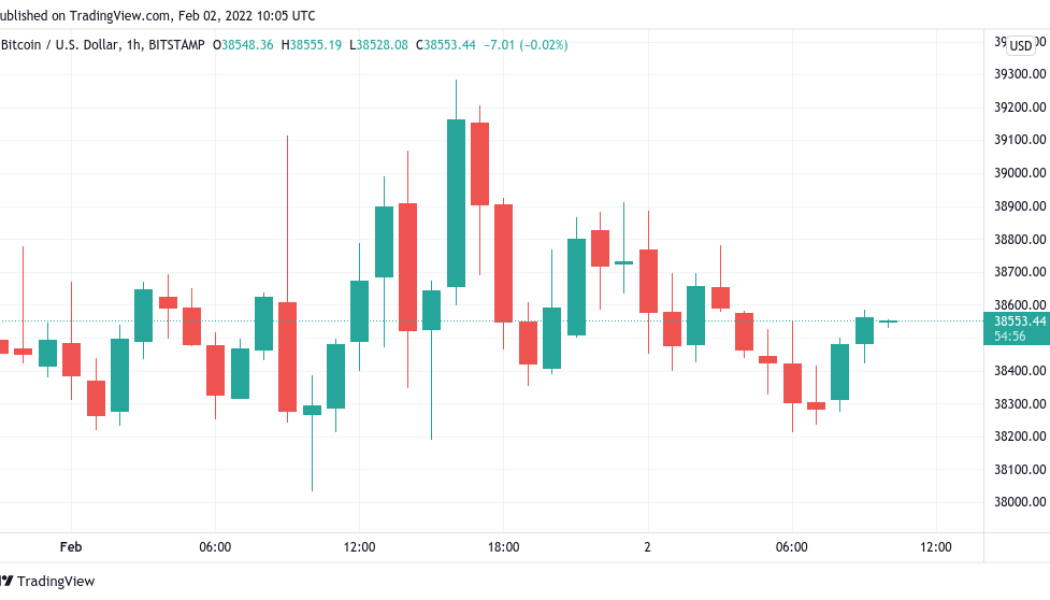
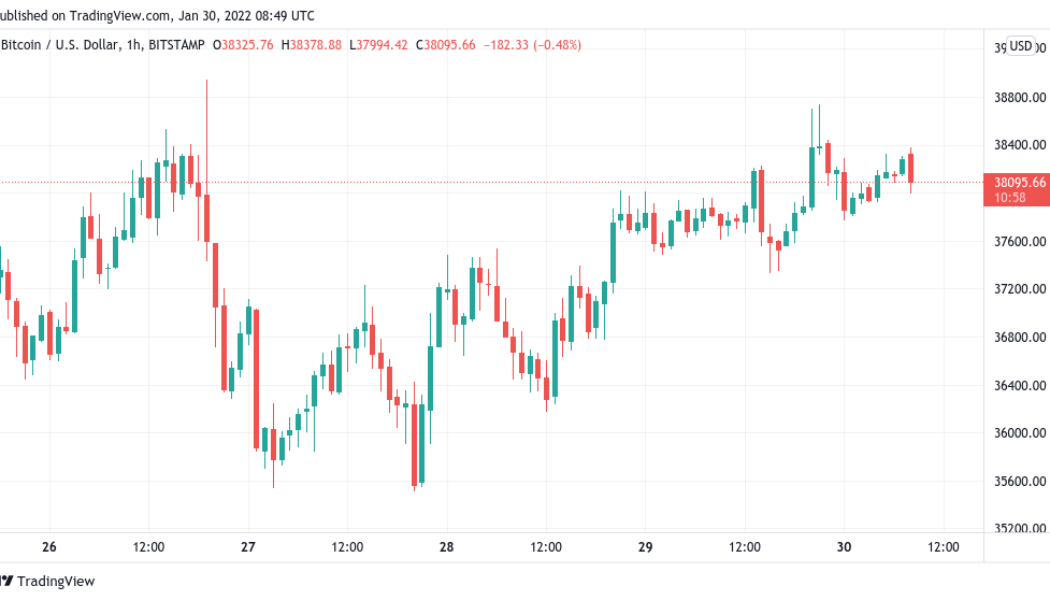
Bitcoin (BTC) circled the $38,000 mark into Jan. 30 as a “trappy” weekend still offered the chance of a solid weekly close. BTC/USD 1-hour candle chart (Bitstamp). Source: TradingView “Choppy waters” for Bitcoin Data from Cointelegraph Markets Pro and TradingView showed BTC/USD regaining the $38,000 mark after seeing local highs of $38,740 on Bitstamp the previous day. Despite its strong “out of hours” performance, few analysts believed in BTC as a firm bullish play without traditional market guidance. “Still choppy waters for Bitcoin,” Cointelegraph contributor Michaël van de Poppe summarized in his latest Twitter update. “Looking at $37K to see whether that sustains. If not -> I’m assuming we’ll test lows for daily...

Bitcoin pundits split over BTC floor as Bloomberg analyst eyes bounce
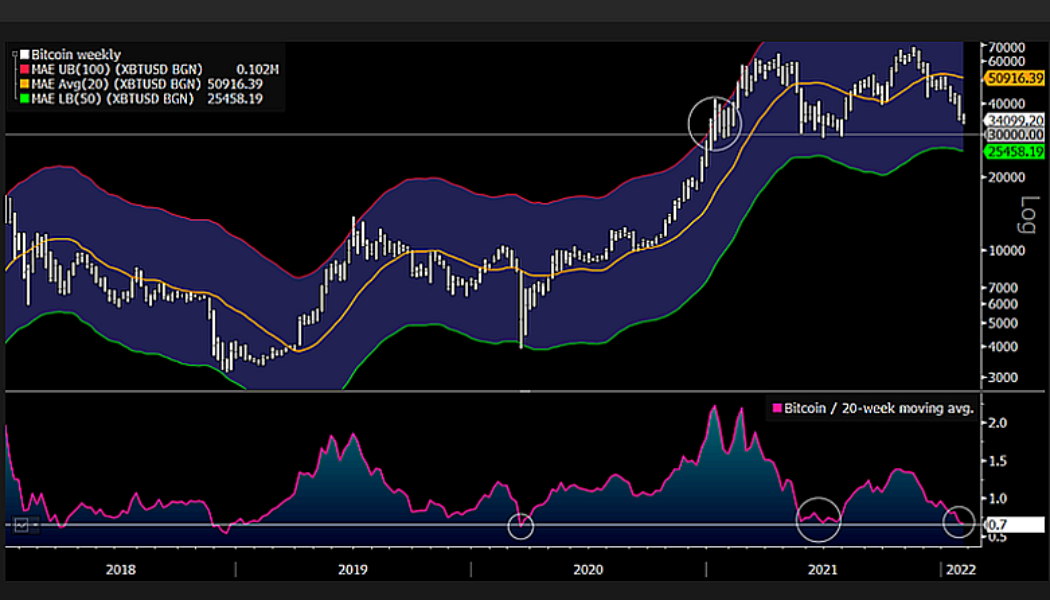
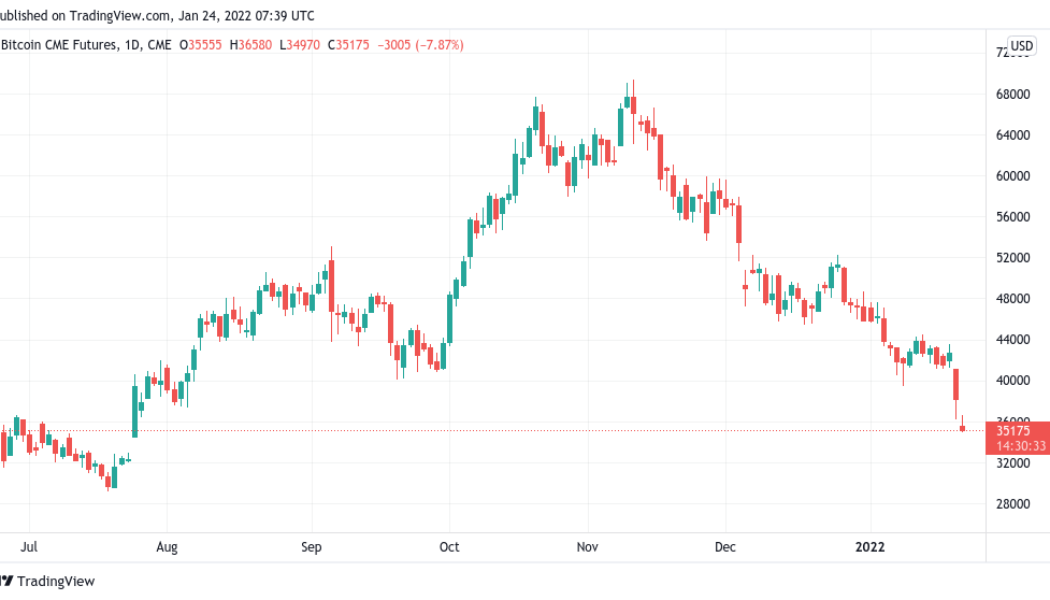
Bitcoin (BTC) could still fall under $30,000, but some prominent sources are already calling the end of the latest bearish turn on BTC/USD. In a tweet on Jan. 25, Mike McGlone, senior commodity strategist at Bloomberg Intelligence, eyed Bitcoin’s position relative to its 20-week moving average, noting that historically, current levels have marked a turning point. McGlone: Bitcoin “a bit extended” at all-time highs Still hopeful for Bitcoin to weather a macro storm this year, McGlone’s data places BTC/USD at the same position in which it halted downtrends in March 2020 and July 2021. Those incidences correspond to the coronavirus cross-march crash and the China miner rout, respectively. “The fact that Bitcoin is an up-and-coming asset, with less than $1 trillion market cap vs. about $100 tr...

Bitcoin holds onto 10% gains ahead of crucial Fed rate hike comments
Bitcoin (BTC) held onto fresh upside on Tuesday after a resurgent stock market took the largest cryptocurrency above $37,500. BTC/USD 1-hour candle chart (Bitstamp). Source: TradingView. Fed may spark fresh volatility Data from Cointelegraph Markets Pro and TradingView showed BTC/USD trading above $36,000 on Tuesday, with maximum 24-hour gains totaling 14% versus Monday’s floor. Bitcoin’s correlation to equities remained in focus ahead of a fresh Wall Street open and key information regarding interest rates from the United States Federal Reserve. The Fed’s Federal Open Market Committee (FOMC) is set to meet Wednesday, and any news regarding interest rates could have instant repercussions for both traditional and crypto markets. “Tomorrow’s FED ...

Illiquid supply ‘going up relentlessly’ — 5 things to watch in Bitcoin this week
Bitcoin (BTC) is starting the final week of January in a place no one wanted but many warned about — a 50% drawdown from all-time highs. A flight to $34,000 means that BTC/USD is now down by half in just two months, and perhaps naturally, concerns are that the losses could continue. With $30,000 so far unchallenged, Bitcoin remains slightly above the trough of its dip from $58,000 to $29,000 last summer. With macro markets facing a tough time of their own thanks to rapidly changing United States Federal Reserve policy, crypto holders will be eyeing their coins’ correlation to traditional assets going forward. Can Bitcoin break the trend? So far, there are few signs that a significant rebound is on the cards, but below the headlines, not all is as it seems when it comes to Bitcoin’s strengt...

Bitcoin ‘enters value zone’ as BTC price floor metric goes green again
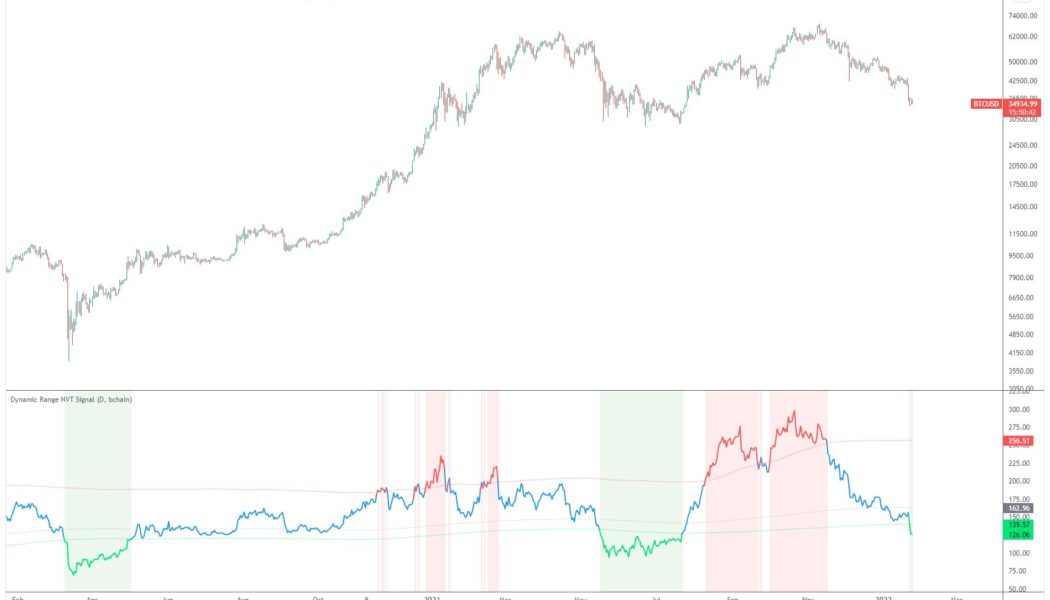
Bitcoin (BTC) has just reentered a key price zone, which has signaled the beginning of the end for bear phases, data confirms. In a tweet on Jan. 24, Charles Edwards, founder of crypto investment firm Capriole, flagged Bitcoin’s network value to transaction (NVT) ratio metric as it delivered a new and rare “oversold” signal. NVT says it’s reversal time Bitcoin price losses accelerated over the weekend, with the market not far off a retest of the seminal $30,000 mark prior to Monday’s Wall Street open. Nonetheless, for on-chain analysts, there are plenty of reasons to believe that the extent of losses seen recently is more of a market overreaction than a taste of things to come. Supporting that thesis is NVT, which calculates how overbought or oversold Bitcoin really is. NVT, first&nb...

Bearish chart pattern hints at $70 Solana (SOL) price before a possible oversold bounce
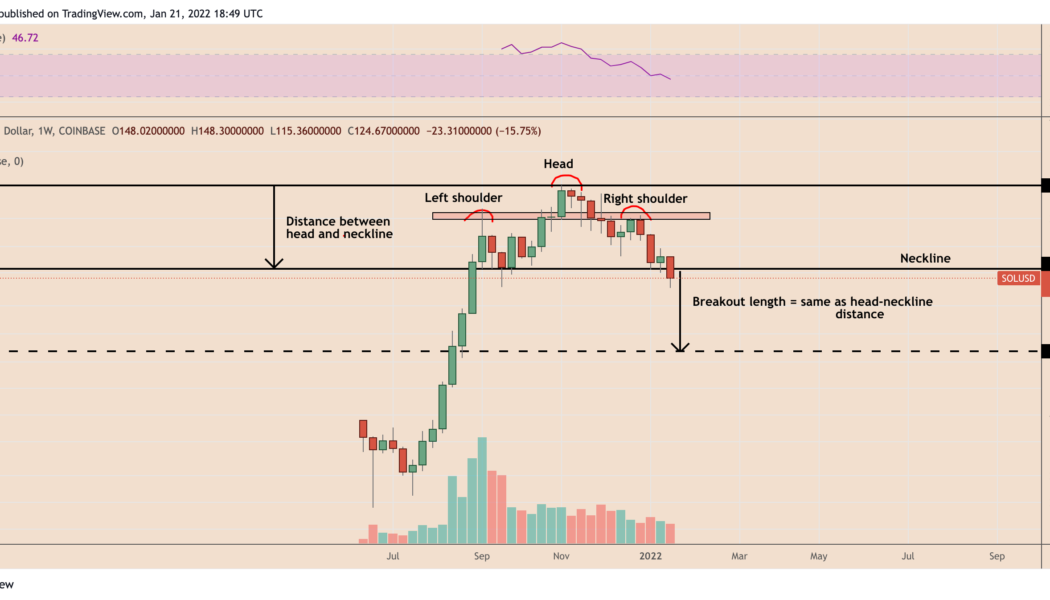
Solana (SOL) price may fall to $70 a token in the coming weeks as a head and shoulders setup emerged on the daily timeframe and possibly points toward a 45%+ decline. The chart below shows that SOL price rallied to nearly $217 in September 2021, dropped to a support level near $134 and then moved to establish a new record high of $260 in November 2021. Earlier this week, the price fell back to test the same $134-support level before breaking to a 2022 low at $87.73. SOL/USD weekly price chart featuring head and shoulders setup. Source: TradingView This phase of price action appears to have formed a head and shoulders setup, a bearish reversal pattern containing three consecutive peaks, with the middle one around $257 (called the “head”) coming out to be higher than the oth...