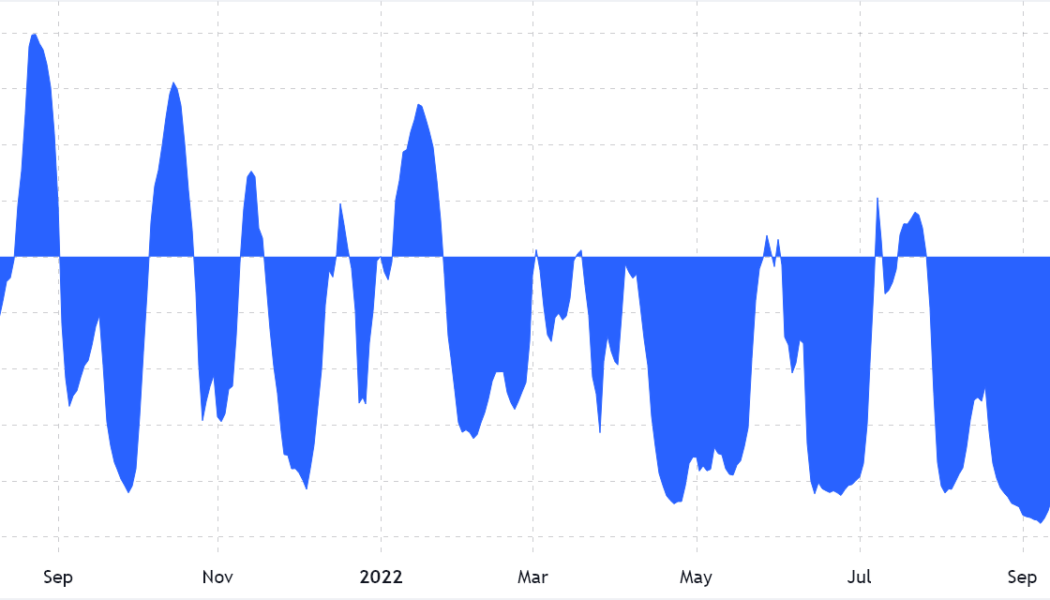
DXY

Bitcoin price liquidation risk increases as BTC struggles to reclaim $18K
Bitcoin (BTC) price had a mixed reaction on Dec. 9 after the November report on United States producer prices showed a 7.4% increase versus 2021. The data suggested that wholesale costs continued to rise and inflation may last longer than investors had previously believed. Oil prices are also still a focus for investors, with crude WTI hitting a new yearly low at $71.10 on Dec. 8. The United States Dollar Index (DXY), a measure of the dollar’s strength against a basket of top foreign currencies, sustained the 104.50 level, but the index traded at 104.10, a 5-month low on Dec. 4. This signals low confidence in the U.S. Federal Reserve’s ability to curb inflation without causing a significant recession. Trader gutsareon noted that the choppy activity caused leverage longs and shorts to...

BTC price tests $17K on PPI as Bitcoin analysts eye CPI, FOMC catalysts
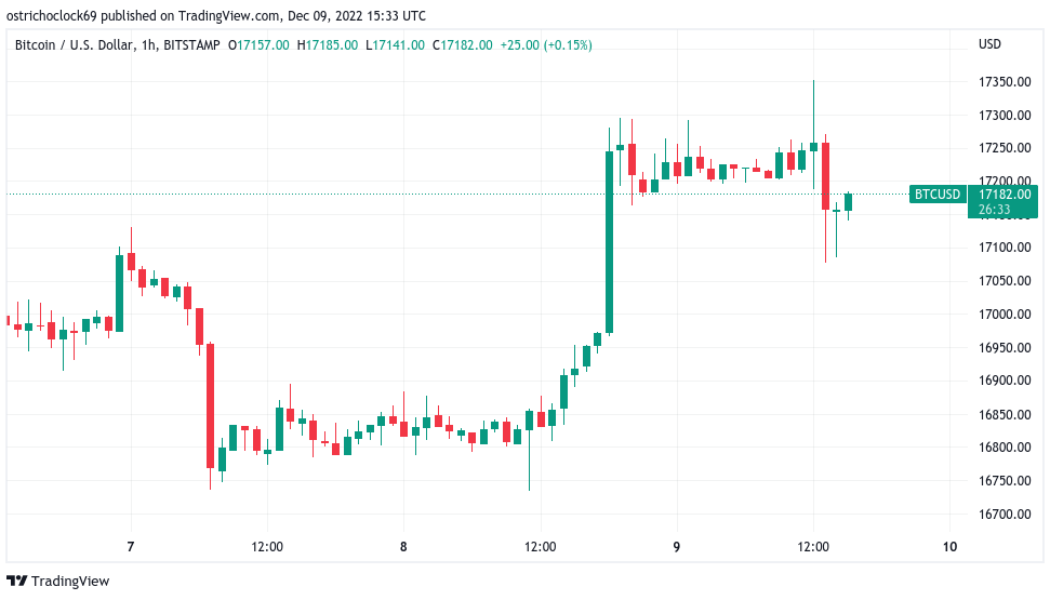
Bitcoin (BTC) fell on the Dec. 9 Wall Street open as United States economic data appeared to disappoint markets. BTC/USD 1-hour candle chart (Bitstamp). Source: TradingView Attention turns to Bitcoin vs. CPI “big trigger” Data from Cointelegraph Markets Pro and TradingView showed BTC/USD dipping to come closer to $17,000 after passing the level overnight. The pair reacted badly to U.S. Producer Price Index (PPI) data, which despite being above expectations still beat the readout from the month prior. “Bit of an over reaction towards PPI, which has been dropping significantly from last month, but less than expected,” Michaël van de Poppe, founder and CEO of trading firm Eight, responded. Van de Poppe, like others, noted that the crux of macro cues would come next week in the for...

DXY bounces at major support, reducing Bitcoin’s chance at breaking the $17.2K resistance
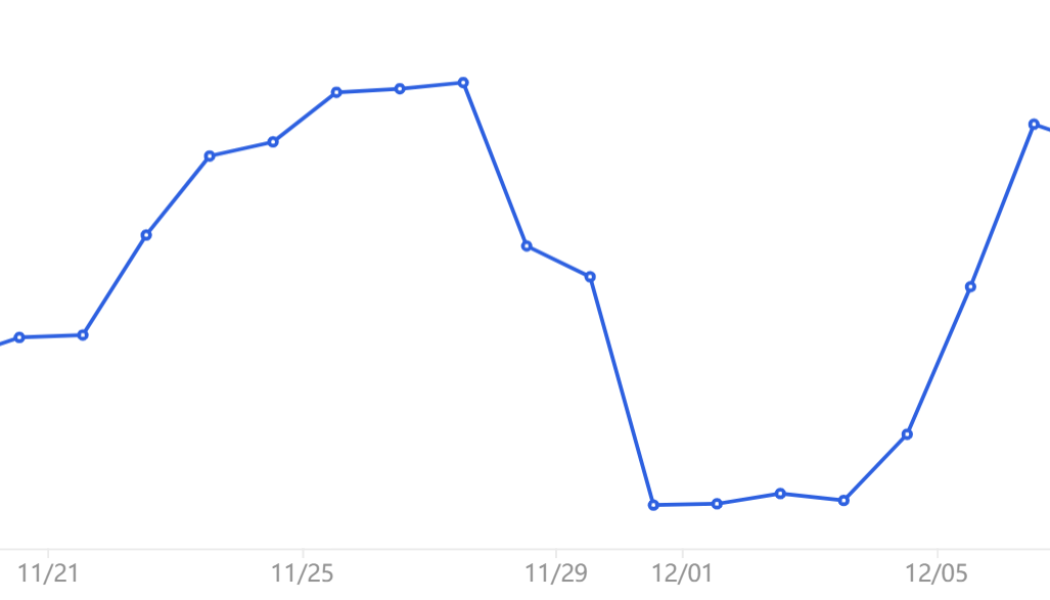
On Dec. 2, the United States dollar index (DXY), an index that measures the dollar’s strength against a basket of top foreign currencies, reached 104.40 which was the lowest level seen in 5 months. To recap, the U.S. dollar’s weight against the basket of top foreign currencies grew by 19.6% in 2022 until late September as investors looked for protection against the impact of a hawkish Federal Reserve and, more recently, the rising energy costs and effect of high inflation. The U.S. dollar’s retreat may have been an interim correction to neutralize its “overbought” condition, as the 114.60 peak was the highest level in 20 years. Still, its inverse correlation with Bitcoin (BTC) remains strong, as pointed out by analyst Thecryer on Twitter: $DXY $BTC pic.t...

‘Get ready’ for BTC volatility — 5 things to know in Bitcoin this week
Bitcoin (BTC) starts a new week keeping everyone guessing as a tiny trading range stays in play. A non-volatile weekend continues a familiar status quo for BTC/USD, which remains just above $19,000. Despite calls for a rally and a run to lower macro lows next, the pair has yet to make a decision on a trajectory — or even signal that a breakout or breakdown is imminent. After a brief spell of excitement seen on the back of last week’s United States economic data, Bitcoin is thus back at square one — literally, as price action is now exactly where it was at the same time last week. As the market wonders what it might take to crack the range, Cointelegraph takes a look at potential catalysts in store this week. Spot price action has traders dreaming of breakout For Bitcoin traders, it is a ca...

Bitcoin price loses $20K as trader warns US dollar ‘not quite topped out’
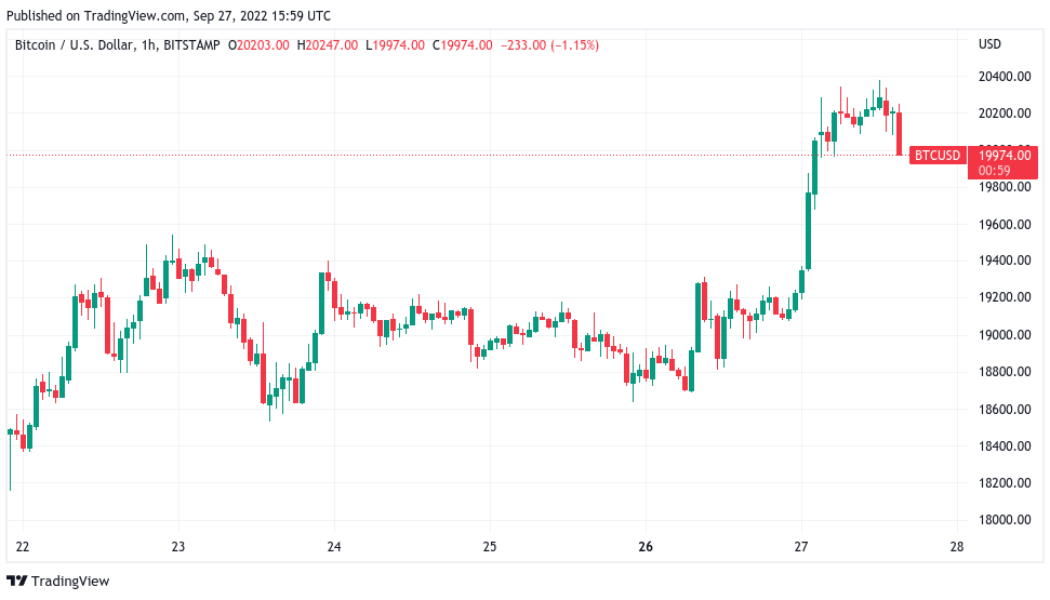
Bitcoin (BTC) crossed under $20,000 after the Sept. 27 Wall Street open as United States equities inched higher. BTC/USD 1-hour candle chart (Bitstamp). Source: TradingView U.S. dollar has room to run — trader Data from Cointelegraph Markets Pro and TradingView confirmed the $20,000 mark barely remaining as tentative support on the day. BTC/USD had managed local highs of $20,344 on Bitstamp overnight, while retracing U.S. dollar strength gave modest relief to risk assets across the board. The S&P 500 and Nasdaq Composite Index had been up 0.4% and 0.65%, respectively, after two hours’ trading, but subsequently reversed. At the same time, the U.S. dollar index (DXY) was down 0.15% on the day, back below the 114 mark but still near its highest since mid-2002. “U.S. open coming up. Green ...


Is it Bitcoin’s time to shine? British pound drops to all-time low against the dollar
On Sept. 26, the British pound hit a record low against the U.S. dollar following the announcement of tax cuts and further debt increases to curb the impact of a possible economic recession. The volatility simply reflects investors’ doubts about the government’s capacity to withstand the growing costs of living across the region. The U.S. dollar has been the clear winner as investors seek shelter in the largest global economy, but the British pound’s weakness could be a net positive for Bitcoin. The GBP, or British pound, is the world’s oldest currency still in use and it has been in continuous use since its inception. Fiat currencies are a 52-year old experiment The British pound, as we currently know, started its journey in 1971 after its convertibility with gold ...

Data challenges the DXY correlation to Bitcoin rallies and corrections ‘thesis’
Presently, there seems to be a general assumption that when the U.S. dollar value increases against other global major currencies, as measured by the DXY index, the impact on Bitcoin (BTC) is negative. Traders and influencers have been issuing alerts about this inverse correlation, and how the eventual reversal of the movement would likely push Bitcoin price higher. Analyst @CryptoBullGems recently reviewed how the DXY index looks overbought after its relative strength index (RSI) passed 78 and could be the start of a retrace for the dollar index. This is literally the only thing you need to look at: The $DXY is crazy overbought right now and due a correction. $BTC is the most oversold it ever has been on the monthly timeframe. BITCOIN AND THE DOLLAR SHARE AN INVERSE CORRELATION. $BTC will...

Bitcoin squeeze to $23K still open as crypto market cap holds key support
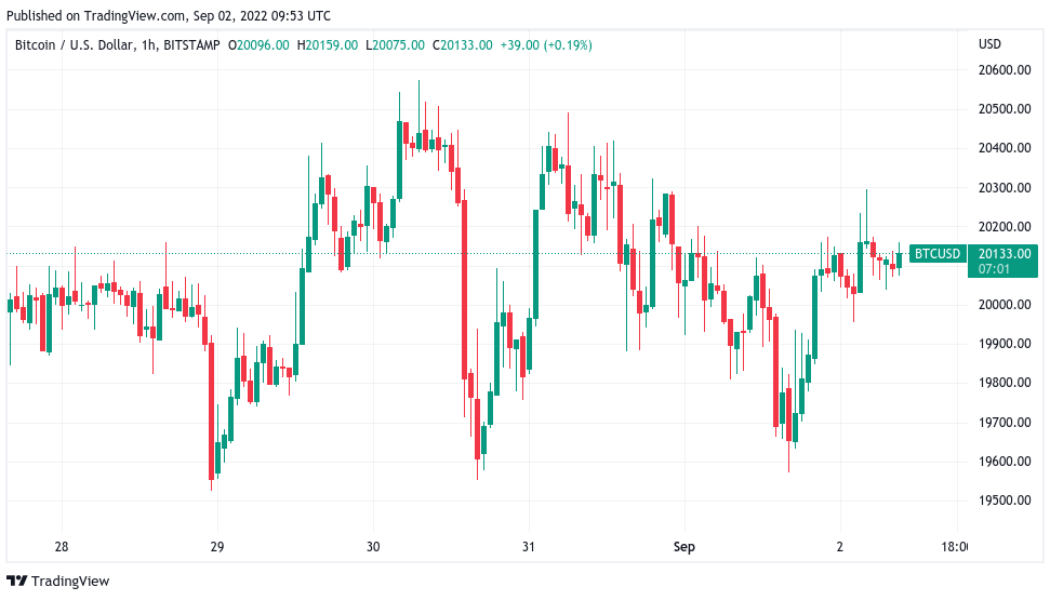
Bitcoin (BTC) returned to $20,000 on Sep. 2 amid renewed bets on a “short squeeze” higher. BTC/USD 1-hour candle chart (Bitstamp). Source: TradingView Trader eyes $20,700 short squeeze trigger Data from Cointelegraph Markets Pro and TradingView showed BTC/USD recovering from another dip below the $20,000 mark on the day, continuing rangebound behavior. The pair gave little insight into which direction the next breakout could be, with opinions differing on the surrounding environment. Amid downside pressure on risk assets and a strong U.S. dollar, overall consensus appeared to favor long-term weakness continuing. For popular trader Il Capo of Crypto, however, there was still reason to believe that a relief bounce could enter first. Thanks to the majority of the market expecting immediate lo...

US dollar smashes yet another 20-year high as Bitcoin price sags 2.7%
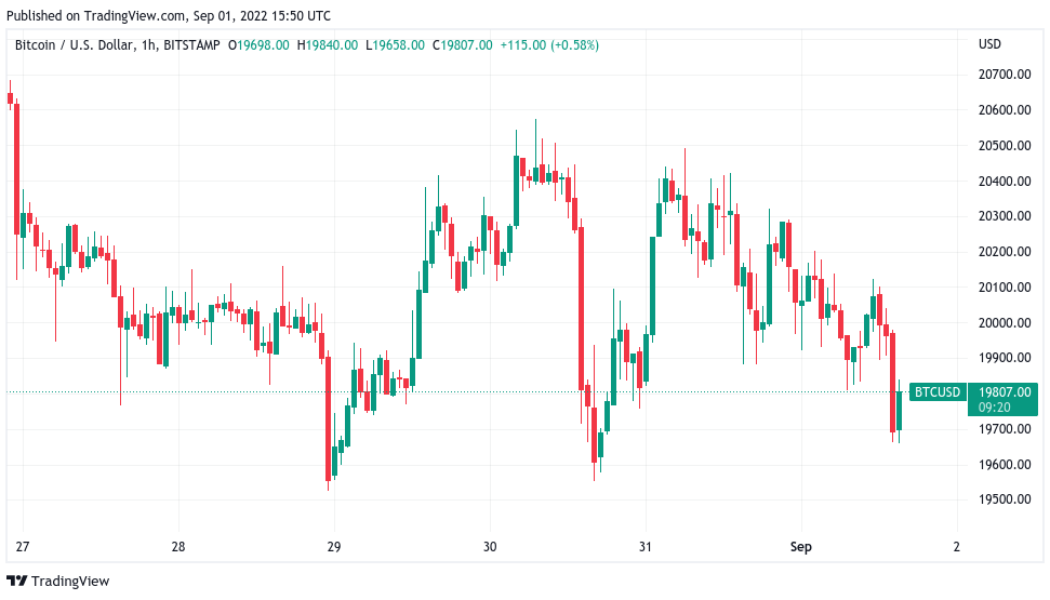
Bitcoin (BTC) faced familiar pressure on the Sept. 1 Wall Street open as the U.S. dollar hit fresh two-decade highs. BTC/USD 1-hour candle chart (Bitstamp). Source: TradingView Trader: DXY could hit 115 before ‘slowdown’ Data from Cointelegraph Markets Pro and TradingView followed BTC/USD as it fell to $19,658 on Bitstamp, down 2.7% from the day’s high. The pair faced stiff resistance trying to flip the important $20,000 mark to solid support, with macro cues further complicating the picture for bulls. That came in the form of a resurgent U.S. dollar index (DXY) on the day, which beat previous peaks to reach 109.97, its highest since September 2002. U.S. dollar index (DXY) 1-day candle chart. Source: TradingView Risk assets thus broadly lost ground, with the S&P 500 and Nas...

Bitcoin erases latest gains with BTC price back below $20K as dollar spikes
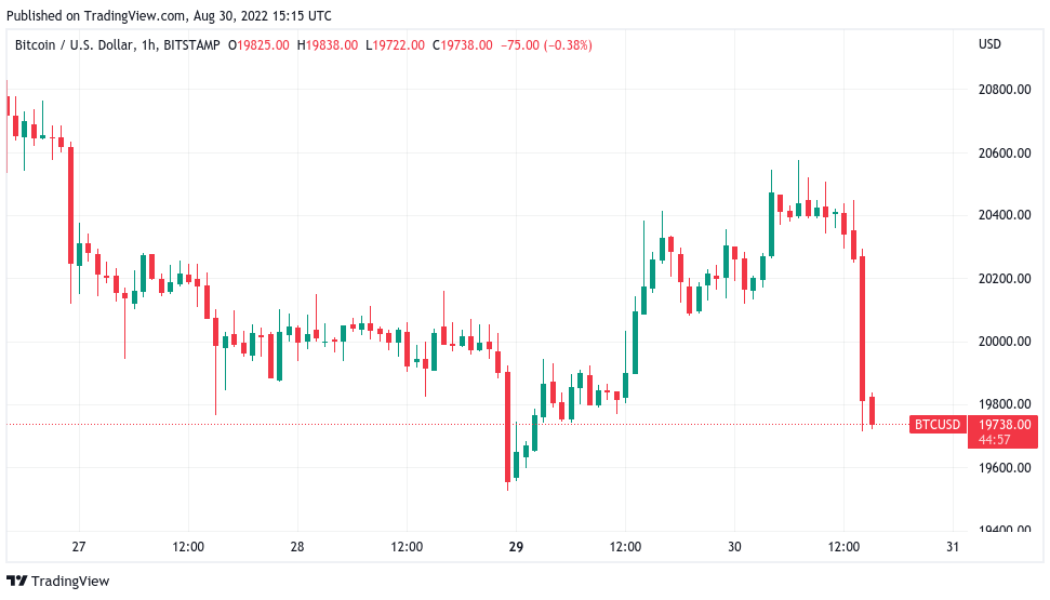
Bitcoin (BTC) fell back below $20,000 after the Aug. 30 Wall Street open as data showed hodlers selling at a loss. BTC/USD 1-hour candle chart (Bitstamp). Source: TradingView June lows look increasingly attractive Data from Cointelegraph Markets Pro and TradingView captured the latest dive below the 2017 bull market peak for BTC/USD, with United States equities dropping in step. The S&P 500 and Nasdaq Composite Index lost 1.1% and 1.25% in the first hour, respectively, while BTC/USD shed 2.5% during a single hourly candle. The latest moves came as no surprise to traders already wary of a deeper correction for the largest cryptocurrency. Previously, many had called for a retracement toward the macro lows seen in June. For popular trader Crypto Ed, both Bitcoin and Ether (ETH) offered go...

Bitcoin lurks by $22K as US dollar falls from peak, Ethereum gains 20%
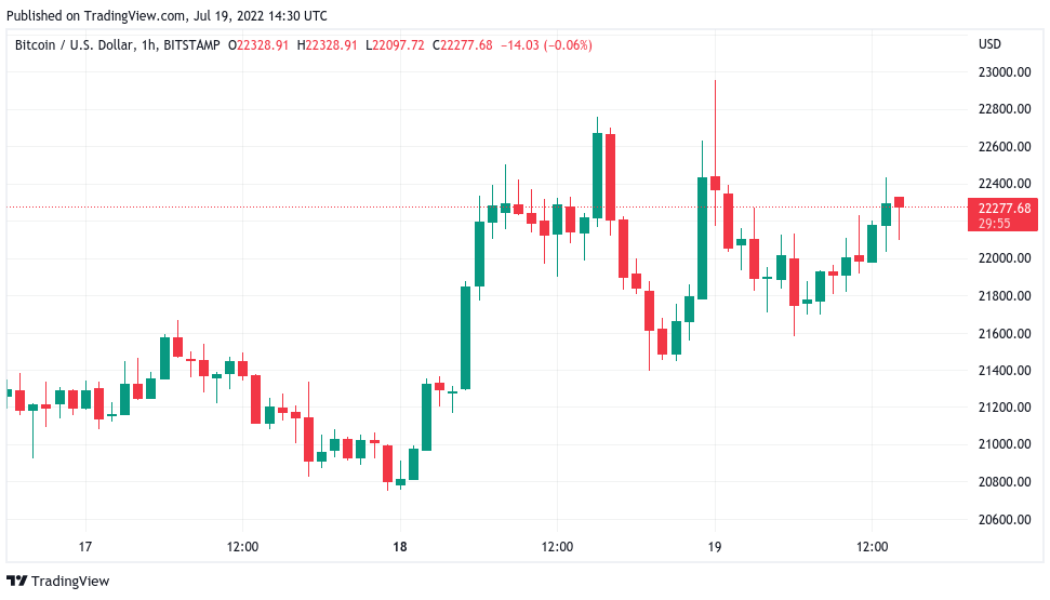
Bitcoin (BTC) hugged $22,000 on July 19 as macro conditions slowly turned to favor risk assets. BTC/USD 1-hour candle chart (Bitstamp). Source: TradingView Stocks, crypto rise as dollar weakens Data from Cointelegraph Markets Pro and TradingView showed BTC/USD cooling volatility immediately below the crucial 200-week moving average (WMA). The Wall Street open saw further gains for United States equities in the face of a declining U.S. dollar, which extended its retracement after hitting its latest two-decade peak. The U.S. dollar index (DXY) stood at around 106.5 at the time of writing, down 2.6% from the high seen July 14. For Bitcoin analysts, it was thus a case of wait and see as markets bided their time between buy and sell levels. $BTC / $USD – Update These are the op...

Bitcoin fights key trendline near $20K as US dollar index hits new 20-year high
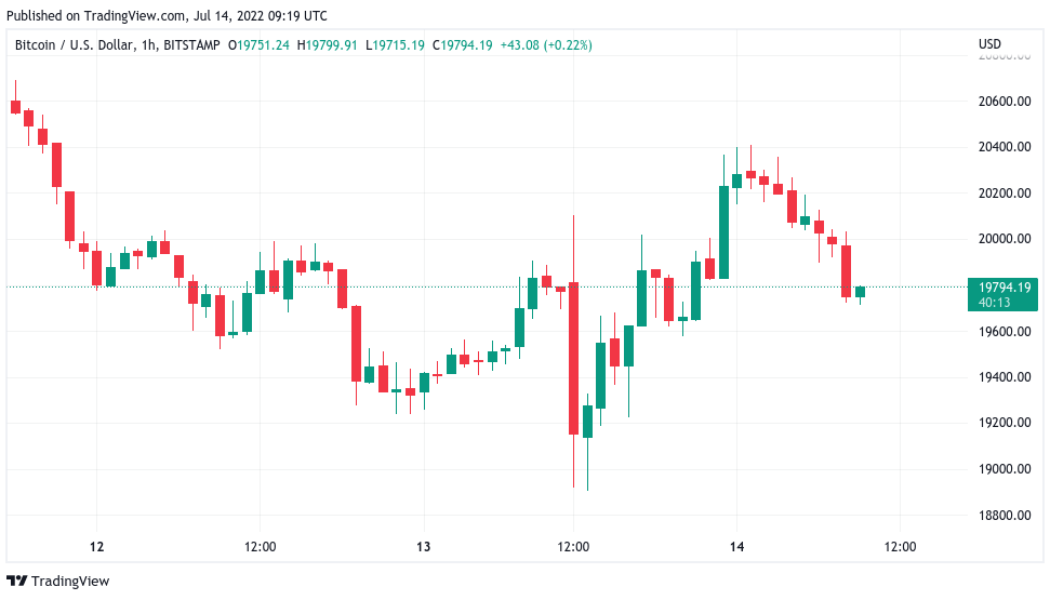
Bitcoin (BTC) found a new focus just under $20,000 on July 14 as U.S. dollar strength hammered out yet another two-decade high. BTC/USD 1-hour candle chart (Bitstamp). Source: TradingView DXY moves bring yen, euro into focus Data from Cointelegraph Markets Pro and TradingView showed BTC/USD rebounding from lows sparked by a fresh 40-year high for U.S. inflation as per the Consumer Price Index (CPI). After briefly dipping under $19,000, the pair took a flight above $20,000 before consolidating immediately below that psychologically significant level. For on-chain analytics resource Material Indicators, it was now “do or die” for BTC price action when it came to a key rising trendline in place since mid-June. On the day, that trendline stood at around $19,600, with BTC/USD n...
- 1
- 2