The S&P 500 index has declined about 5% this week while the Nasdaq Composite is down more than 5.5%. Investors fear that the Federal Reserve’s aggressive rate hikes could cause an economic downturn. The yield curve between the two-year and 10-year Treasury notes, which is watched closely by analysts for predicting a recession, has inverted the most since the year 2000.
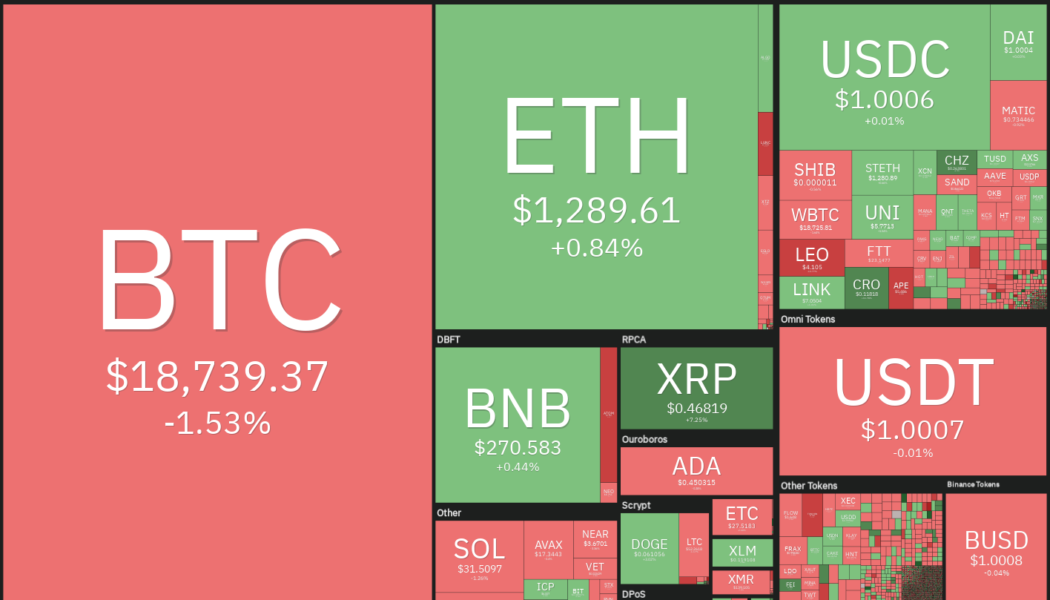
Among all the mayhem, it is encouraging to see that Bitcoin (BTC) has outperformed both the major indexes and has fallen less than 4% in the week. Could this be a sign that Bitcoin’s bottom may be close by?

On-chain data shows that the amount of Bitcoin supply held by long-term holders in losses reached about 30%, which is 2% to 5% below the level that coincided with Bitcoin’s bottom in March 2020 and December 2018. This metric suggests that Bitcoin could have more room to fall before it bottoms out.
Let’s study the charts of the S&P 500 index, the U.S. dollar index (DXY) and the major cryptocurrencies to determine whether the trend will continue or if a reversal is likely.
SPX
The S&P 500 index (SPX) broke below the 3,900 support on Sept. 16 and the bears successfully defended the level on retests on Sept. 17 and 21. Hence, this becomes an important level to keep an eye on as a break above 3,900 will be the first sign that bulls are on a comeback.

The downsloping 20-day exponential moving average (EMA) (3,920) indicates an advantage to bears but the relative strength index (RSI) in the oversold territory suggests that the index may attempt a rebound from the strong support zone between 3,715 and 3,636.
A weak rebound off this zone will indicate a lack of aggressive buying by the bulls. That could increase the possibility of a decline below the crucial June low at 3,636. If this support collapses, the index could plunge toward 3,325.
On the contrary, a strong rebound off the support zone could result in a recovery to 3,900. A break above this resistance could signal a potential trend change in the near term.
DXY
The U.S. dollar index (DXY) has been in a strong uptrend for the past few months. Every dip is being purchased aggressively and the index continues to scale new heights. Attempts by the bears to force a trend change failed when the price rebounded off the 50-day simple moving average (SMA) ($108) on Sept. 13.

After staying in a tight range for a few days, the index broke out to a new 52-week high on Sept. 21. This resumed the uptrend and the index could next attempt a rally to 115.
The sharp rally of the past few days has pushed the RSI into the overbought zone, which suggests a minor consolidation or correction is possible in the next few days.
The 20-day EMA (109) is an important support to watch for on the downside because a break below it could sink the price to the 50-day SMA. The bears will have to pull the price below 107 to indicate a possible trend change in the near term.
BTC/USDT
Buyers have been buying the dip below $18,626 in Bitcoin but the failure to push the price above the 20-day EMA ($19,841) shows that bears are in no mood to let go of their advantage. This increases the possibility of a retest of the vital June low at $17,622.

A break and close below $17,622 could create panic and the BTC/USDT pair may plummet to the next major support at $14,500.
While the downsloping moving averages indicate advantage to bears, the positive divergence on the RSI suggests that the selling pressure could be reducing. This view could strengthen if bulls drive and sustain the price above the 20-day EMA.
That could push the price toward the overhead resistance zone between the 50-day SMA (21,200) and $22,799. Such a move will suggest that the pair may continue its bottoming formation inside the large range between $17,622 and $25,211 for longer.
ETH/USDT
Ether (ETH) has been trading inside a descending channel pattern for the past few days. In a channel, traders usually buy near the support and sell close to the resistance.

The bears tried to sink the price below the channel on Sept. 21 but the bulls defended the level successfully. The bulls will try to push the price to the 20-day EMA ($1,467) where they may face stiff resistance from the bears.
If the price turns down from the current level or the 20-day EMA, it will suggest that the sentiment remains negative and traders are selling on every minor rally. The bears will then again try to pull the price below the channel and challenge the psychological support at $1,000.
Contrarily, if the price rises above the 20-day EMA, the pair could reach the resistance line of the channel. A break and close above the channel could suggest a potential trend change.
BNB/USDT
BNB has been oscillating between the 20-day EMA ($276) and $258 for the past few days. This shows that the bulls are defending the immediate support at $258 but they have failed to push the price above the 20-day EMA.

This tight-range trading is unlikely to continue for long. If buyers propel the price above the 20-day EMA, the BNB/USDT pair could rise to the resistance line of the descending channel. The bulls will have to overcome this obstacle to suggest that the corrective phase may be over. The pair could then attempt a rally to $338.
If the price turns down from the current level or the resistance line of the channel, the bears will again try to sink the pair below $258. If they manage to do that, the pair could decline to the support line.
XRP/USDT
XRP broke above the $0.41 overhead resistance on Sept. 20. The bears tried to trap the aggressive bulls on Sept. 21 but the buyers had other plans. They purchased the dip with vigor and thrust the price above the overhead resistance on Sept. 22.

The pattern target of the break from the $0.30 to $0.41 range was $0.52 and the same was reached on Sept. 23. This sharp move pushed the RSI into the overbought territory, suggesting a minor correction or consolidation in the near term. The long wick on the Sept. 23 candlestick shows profit-booking at higher levels.
Usually, after the breakout from a range, the price tends to retest the breakout level. In this case, the price could drop to $0.41. If bulls flip this level into support, the XRP/USDT will try to resume the up-move. If the price rises above $0.56, the next stop could be $0.66. On the other hand, a break below $0.41 could suggest that the recent breakout was a bear trap.
ADA/USDT
Cardano (ADA) bounced off the uptrend line on Sept. 22, indicating that bulls are defending this level with vigor. The price reached near the downtrend line on Sept. 23 but the long wick on the candlestick shows that bears are active at higher levels.

The 20-day EMA ($0.46) has started to turn down and the RSI is just below the midpoint, indicating a minor advantage to bears. If the price continues lower and plummets below the uptrend line, the ADA/USDT pair could drop to $0.40. This is an important level for the bulls to defend because a break below it could resume the downtrend.
If bulls want to gain the upper hand, they will have to drive and sustain the price above the downtrend line. The pair could then rise to $0.60 where the bears may again mount a stiff resistance.
Related: XRP hits 13-month high versus Bitcoin with 35% daily surge — But is a correction inevitable?
SOL/USDT
Solana (SOL) has been getting squeezed between the 20-day EMA ($33) and the immediate support at $30. This indicates a state of equilibrium between buyers and sellers.

This uncertainty is unlikely to continue for long. The bears will try to seize control by pulling the price below $30. If that happens, the SOL/USDT pair could drop to the strong support at $26. The bulls are expected to defend this level aggressively because if this support cracks, the SOL/USDT pair could witness panic selling and drop toward $20.
To invalidate this negative view in the short term, buyers will have to drive the price above the moving averages and the overhead resistance at $39. If they succeed, the pair could rally to $48.
DOGE/USDT
Buyers bought the dip below the immediate support on Sept. 21 but they are struggling to sustain Dogecoin (DOGE) above the 20-day EMA ($0.06) on Sept. 23. This suggests that bears continue to sell on rallies.

The bears will attempt to increase their advantage by sinking the price below the immediate support near $0.06. If they do that, the DOGE/USDT pair could extend its decline to the June low at $0.05. This is a pivotal level because a break below it could indicate the start of the next leg of the downtrend.
Conversely, if the price sustains above the 20-day EMA, the pair could rise to the 50-day SMA ($0.07). If bulls pierce this resistance, the pair could rally toward $0.09.
DOT/USDT
Buyers successfully defended the critical support of $6 on Sept. 21 and 22 but the shallow bounce suggests that demand dries up at higher levels. The longer Polkadot (DOT) trades below the 20-day EMA (6.87), the greater the possibility of a break below $6.

If bears sink and sustain the price below $6, the selling momentum could pick up and the DOT/USDT pair could resume its downtrend. The next major support on the downside is at $4.
Alternatively, if the price rebounds off $6 or turns up sharply after breaking below the support, it will suggest that bulls continue to buy at lower levels. The bulls will have to propel the price above the moving averages to clear the path for a possible up-move to $10, which, again, is likely to act as a barrier.
The views and opinions expressed here are solely those of the author and do not necessarily reflect the views of Cointelegraph. Every investment and trading move involves risk. You should conduct your own research when making a decision.
Market data is provided by HitBTC exchange.
 [flexi-common-toolbar] [flexi-form class=”flexi_form_style” title=”Submit to Flexi” name=”my_form” ajax=”true”][flexi-form-tag type=”post_title” class=”fl-input” title=”Title” value=”” required=”true”][flexi-form-tag type=”category” title=”Select category”][flexi-form-tag type=”tag” title=”Insert tag”][flexi-form-tag type=”article” class=”fl-textarea” title=”Description” ][flexi-form-tag type=”file” title=”Select file” required=”true”][flexi-form-tag type=”submit” name=”submit” value=”Submit Now”] [/flexi-form]


Tagged: Binance Coin, Bitcoin, Cardano, crypto blog, Crypto news, Dogecoin, Ethereum, Markets, Polkadot, Price analysis, Ripple, S&P 500, Solana, US Dollar