BTC price

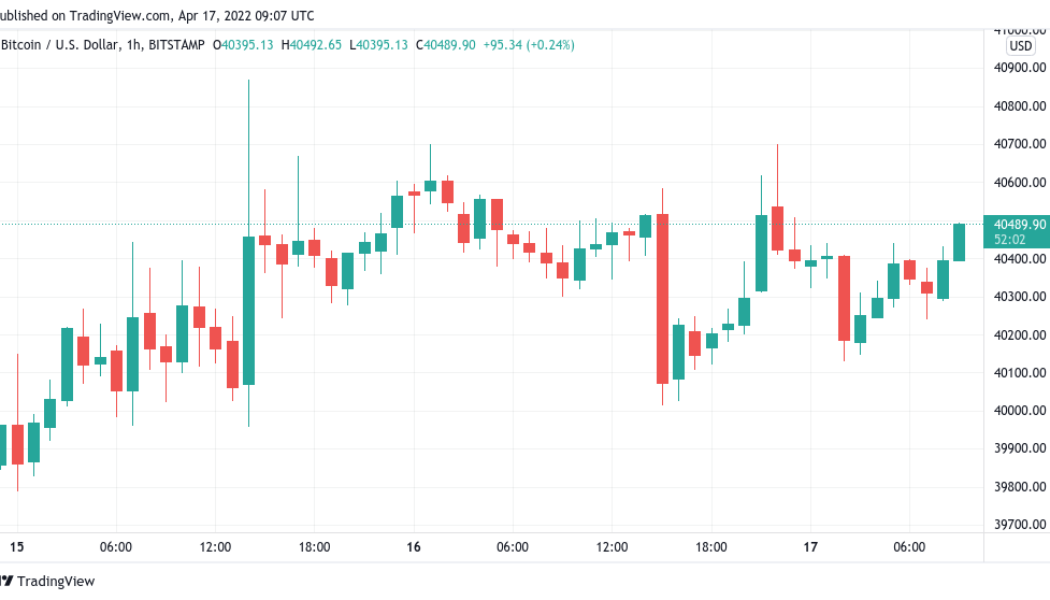
Bitcoin spoofs $39.5K breakout at Wall St open as Elon Musk Twitter takeover nears
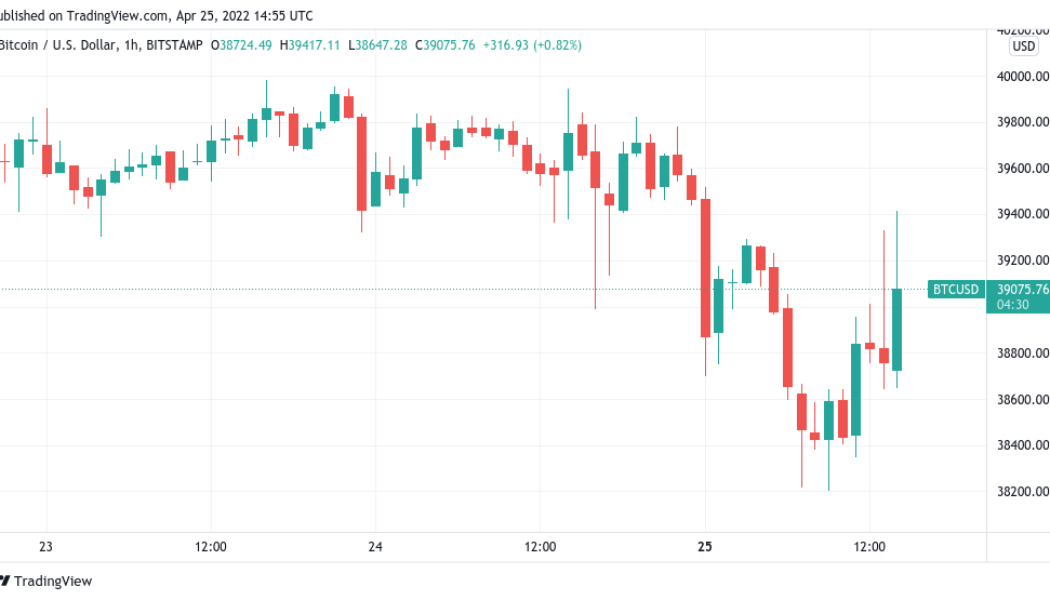
Bitcoin (BTC) saw a classic “fakeout” move on April 25 as volatility kept traders firmly on edge. BTC/USD 1-hour candle chart (Bitstamp). Source: TradingView Traders stay gloomy on BTC outlook Data from Cointelegraph Markets Pro and TradingView showed BTC/USD briefly climbing almost $1,000 as Monday’s Wall Street trading session began. The move was short-lived, the pair coming back down to where it started within an hour after hitting local highs of $39,517 on Bitstamp. Monday had begun with a whimper for Bitcoin bulls, who lost ground on the weekly close and failed to avoid $40,000 flipping to resistance on daily timeframes. For popular trader Crypto Ed, $30,000 was still on the table as a potential short-term target. “To me, it seems any bounce we...

Bitcoin sets up lowest weekly close since early March as 4th red candle looms
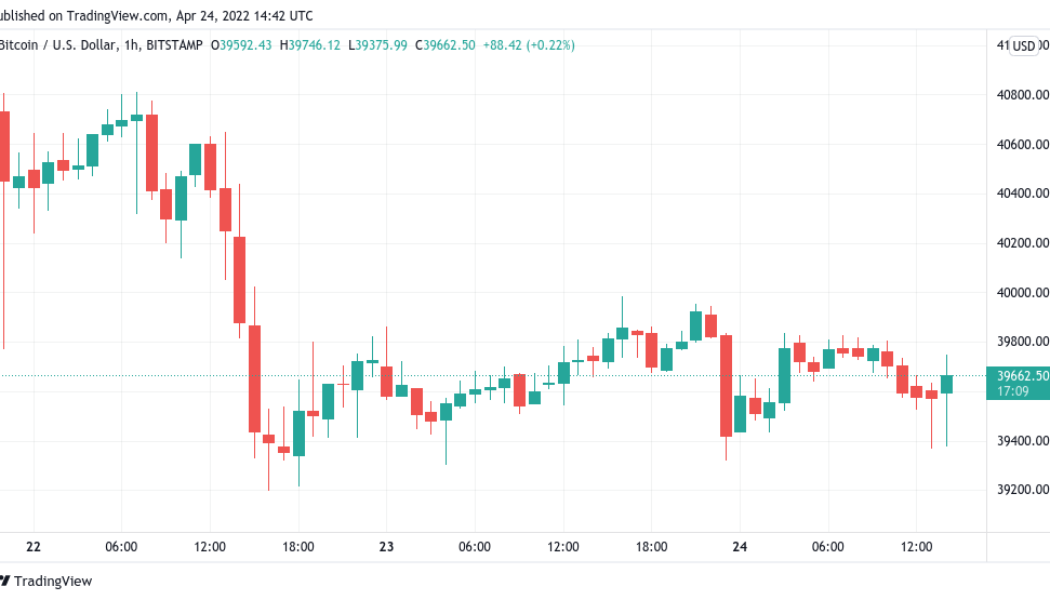
Bitcoin (BTC) stayed below $40,000 on April 24 as the weekly close looked set to be a painful one for bulls. BTC/USD 1-hour candle chart (Bitstamp). Source: TradingView Binance bids slowly thin below spot Data from Cointelegraph Markets Pro and TradingView showed BTC/USD failing to retake the $40,000 mark after losing it before the weekend. As traders braced for classic volatility into the weekly close, Bitcoin looked decidedly unappetizing. At $39,500 on Bitstamp, the spot price at the time of writing would constitute the lowest weekly close since the week of March 7. BTC/USD 1-week candle chart (Bitstamp). Source: TradingView “Pretty obvious uptrend since mid-to-late January imo. If we have our 4th RED weekly close today could be bad though,” Twitter account CryptoBull comment...

‘Something sure feels like it’s about to break’ — 5 things to know in Bitcoin this week
Bitcoin (BTC) starts a new week in an uncertain place facing uncertain times — is $40,000 now resistance? The largest cryptocurrency has just closed a fourth red weekly candle in a row, something that has not happened since June 2020. As cold feet over the macro market outlook continues to be the norm, there seems little to comfort bulls as the week gets underway — and Bitcoin is not done selling off yet. On the back of $4,000 in losses over the past four days alone, price targets now focus on retests of liquidity levels further towards $30,000. It is not all doom and gloom — long-term hodlers and key participants such as miners are showing a more positive stance when it comes to Bitcoin as an investment. With that in mind, Cointelegraph takes a look at the forces at work when it comes to ...

Bitcoin funding rates show demand to short BTC as $40K becomes resistance
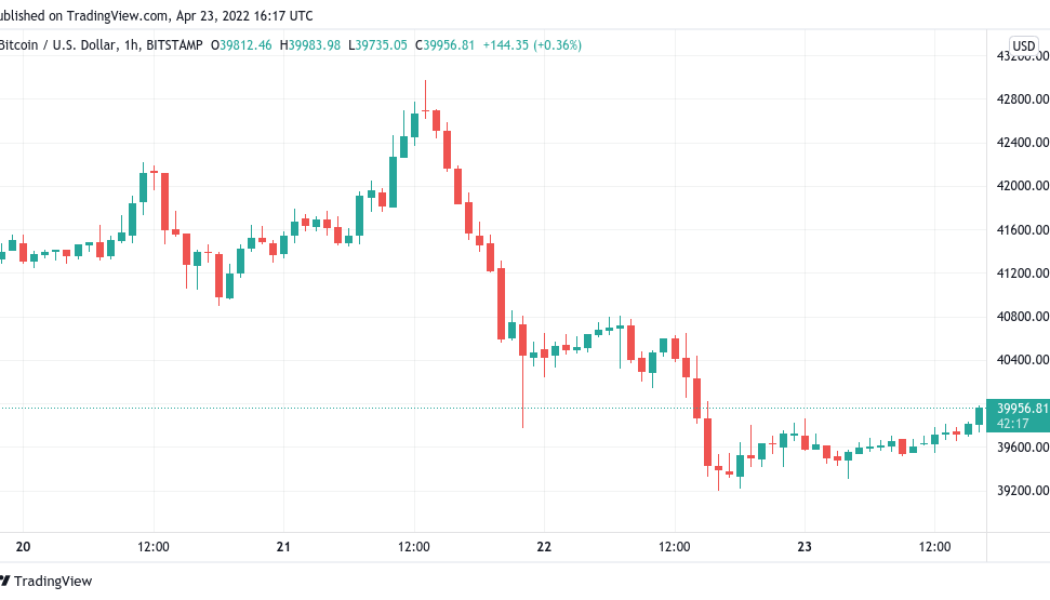
Bitcoin (BTC) consolidated under $40,000 on April 23 as market expectations favored further losses. BTC/USD 1-hour candle chart (Bitstamp). Source: TradingView “Extreme fear” accompanies Bitcoin’s descent to $39,200 Data from Cointelegraph Markets Pro and TradingView followed a bearish BTC/USD after the pair touched $39,200 on Friday’s Wall Street open. Falling in line with stocks, Bitcoin now faced the prospect of resistance cementing itself at the $40,000 mark, with traders showing their lack of confidence in a short-term rebound. Data from on-chain analytics site Coinglass confirmed that funding rates across derivatives exchanges were firmly negative into the weekend, suggesting that the majority of market participants expected shorting to be a profitable ne...
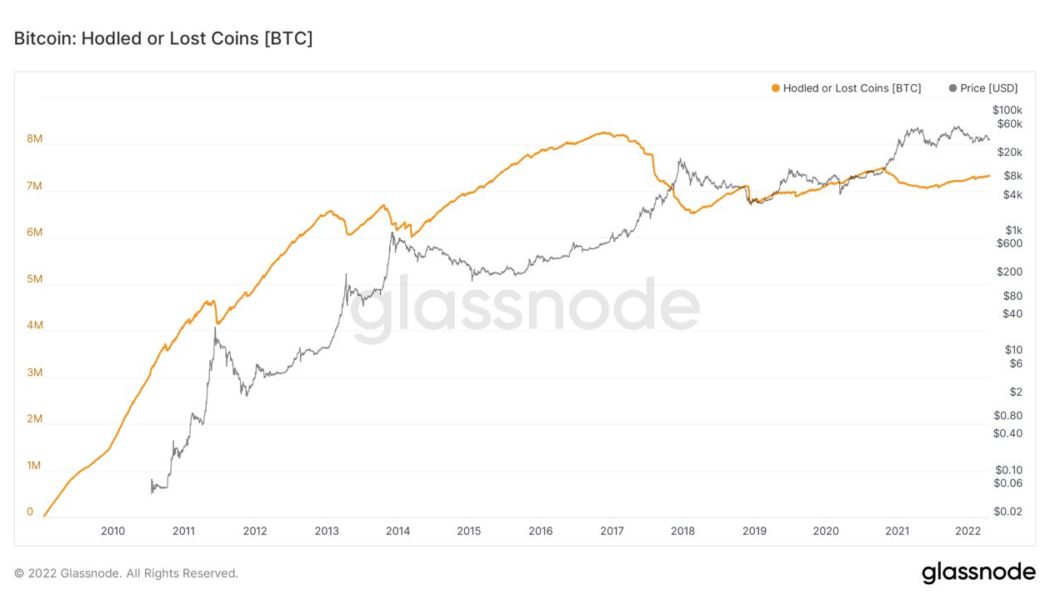

Bitcoin hodlers targeting $100K is what’s preventing 40% price drawdown, data suggests
Bitcoin (BTC) dropping to $25,000 or lower is unlikely thanks to hodlers hoping for all-time highs, not speculative traders, new research says. In a series of tweets on April 19, popular analyst Root argued that there is “no real reason” for a dramatic Bitcoin sell-off. No major selling from “maturing” hodlers Bitcoin has yet to wow the market with its all-time highs this halving cycle, and this has contributed to a loss of faith among some investors. At the same time, on-chain indicators remain much more bullish than spot price action, and those investors still in the market support the idea that BTC/USD will go far higher in the future. This is thanks to a lack of short-term holders (STHs) on the market, Root notes. Even the most recent all-time highs of $69,000 last November...

Bitcoin holds $40K over Easter but thin liquidity, ‘capitulation’ risk haunt traders
Bitcoin (BTC) chose compression over the Easter weekend, sparing nervous traders a fresh dive below $40,000. BTC/USD 1-hour candle chart (Bitstamp). Source: TradingView Derivatives traders take no risks Data from Cointelegraph Markets Pro and TradingView showed BTC/USD acting in a narrowing range with $40,700 as its ceiling Saturday and Sunday. The pair saw little action as the holiday period began, with United States equities markets off from Good Friday onwards, allowing crypto to avoid correlation-based volatility. With Monday likewise a non-trading day, Bitcoin was set for four days of “out-of-hours” trading. While that meant its stocks correlation mattered less, there were other forces at play ready to spook sentiment. Market liquidity stayed lower than on workdays, a...
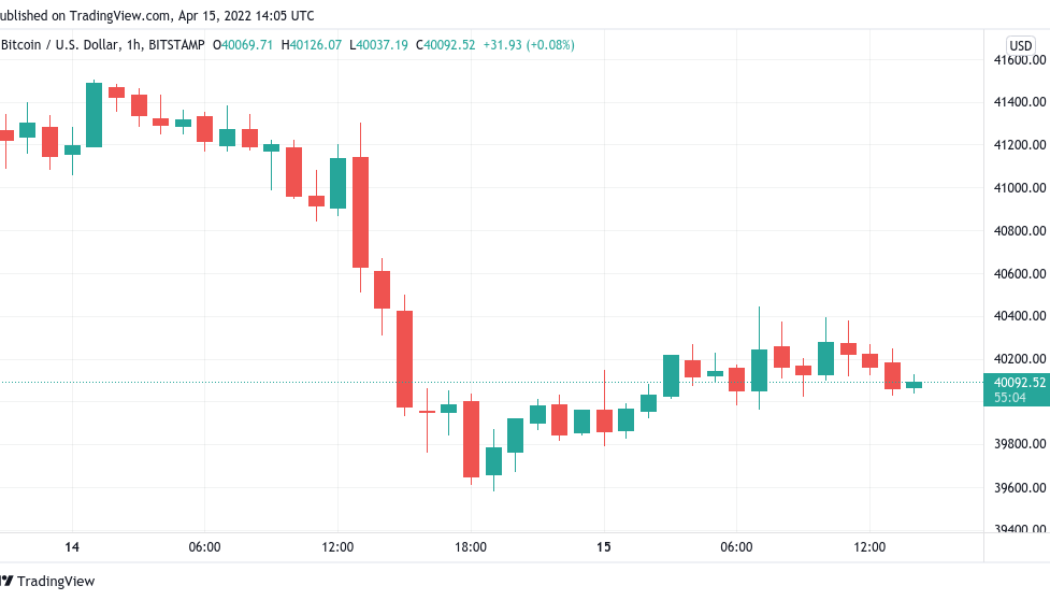

Bitcoin clings to $40K support as focus returns to BTC price ‘supercycle’
Bitcoin (BTC) fooled no one with its criss-crossing of $40,000 on April 15 as traders remained firmly risk-off on BTC. BTC/USD 1-hour candle chart (Bitstamp). Source: TradingView Bitcoin returns to key 2022 Fib level Data from Cointelegraph Markets Pro and TradingView showed BTC/USD bouncing modestly after returning to the $39,500 zone on April 14. The move erased an impulse move higher from earlier in the week, underscoring the lack of bullish market momentum despite conspicuous demand for Bitcoin among institutional buyers. For popular trader Crypto Ed, there was reason to believe that further downside would soon ensue. Current levels, he warned viewers in his latest YouTube update, did not constitute a suitable ground for a long position. “With the upcoming weekend, I would b...
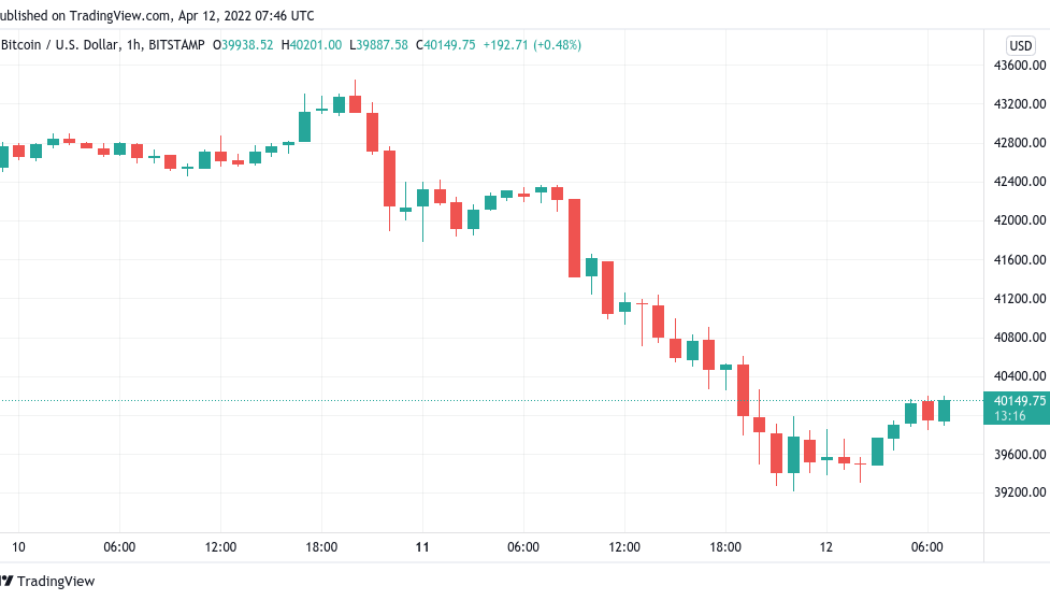

Bitcoin claws back $40K as 24-hour crypto liquidations near $500M
Bitcoin (BTC) attempted to reclaim $40,000 as support on April 12 after a troubling start to the week saw BTC/USD hit three-week lows. BTC/USD 1-hour candle chart (Bitstamp). Source: TradingView “Extraordinarily elevated” CPI data due Data from Cointelegraph Markets Pro and TradingView showed the largest cryptocurrency bouncing to $40,200 on Bitstamp Tuesday after falling to just $39,300. Spurred on by a bleed-out in tech stocks in particular, Bitcoin looked decidedly unappetizing on short timeframes, and those previously betting on bullish continuation were left empty-handed. According to on-chain monitoring resource Coinglass, the past 24 hours cost crypto traders a total of $428 million in liquidated long positions — the most in a day since Jan. 22. Crypto liquidations ...
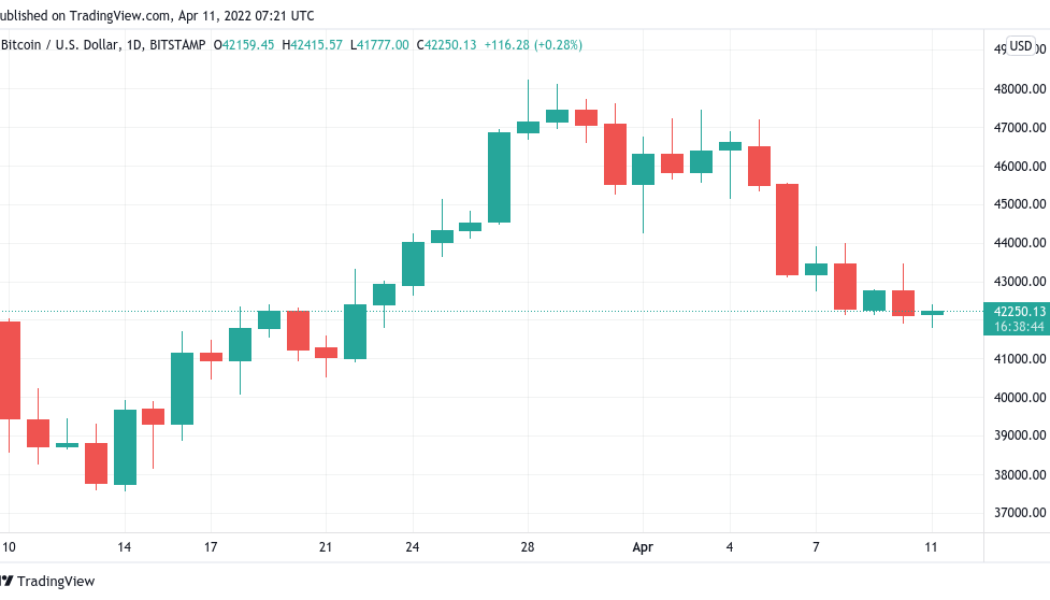

BTC stocks correlation ‘not what we want’ — 5 things to know in Bitcoin this week
Bitcoin (BTC) starts the second week of April with a whimper as bulls struggle to retain support above $40,000. After a refreshingly low-volatility weekend, the latest weekly close saw market nerves return, and in classic style, BTC/USD fell in the final hours of April 10. There is a feeling of being caught between two stools for the average hodler currently — macro forces promise major trend shifts but are being slow to play out. At the same time, “serious” buyer demand is also absent from crypto assets more broadly. However, those on the inside show no hint of doubt about the future, as evidenced by all-time high Bitcoin network fundamentals and more. The combination of these opposing factors is price action that simply does not seem to know where to go next. Can something change in the ...
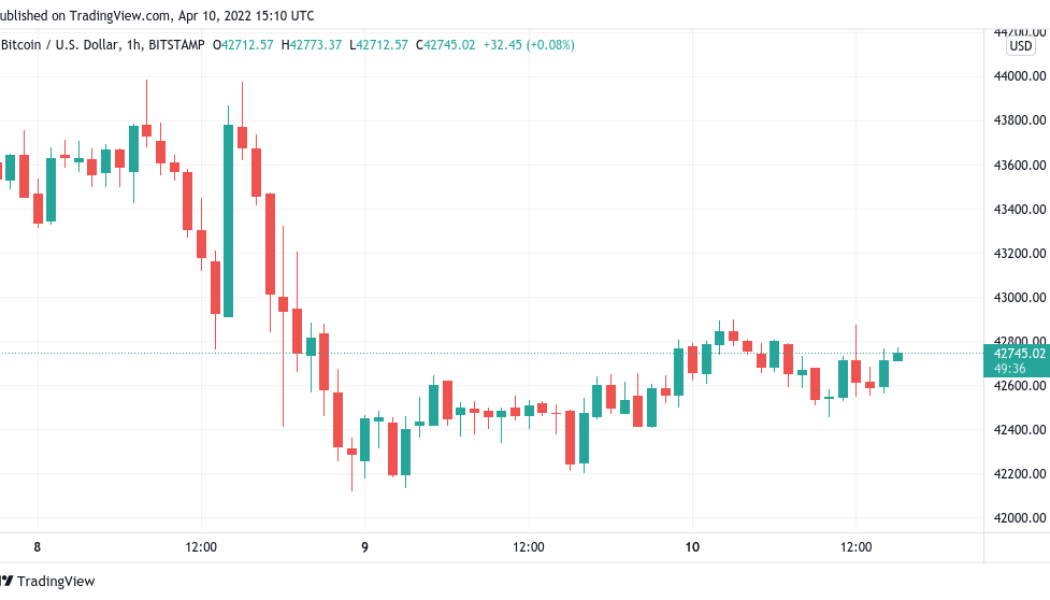

Bitcoin battles for weekly close above $42K as LFG buys 4,130 more BTC
Bitcoin (BTC) prepared for its lowest weekly close of the month so far on April 10 after a week of disappointing losses. BTC/USD 1-hour candle chart (Bitstamp). Source: TradingView Trader: BTC “giving people a second chance” Data from Cointelegraph Markets Pro and TradingView showed BTC/USD circling $42,700 Sunday with a matter of hours to go until the conclusion of the weekly candle. The pair had fallen into the end of Wall Street trading Friday, while the weekend provided some nervous calm as $42,000 support remained intact. For popular trader and analyst Rekt Capital, there was still cause for optimism despite the past seven days seeing losses of nearly 10%. This #BTC pullback is a second chance for a lot of people If you promised yourself that you’ll buy $BT...
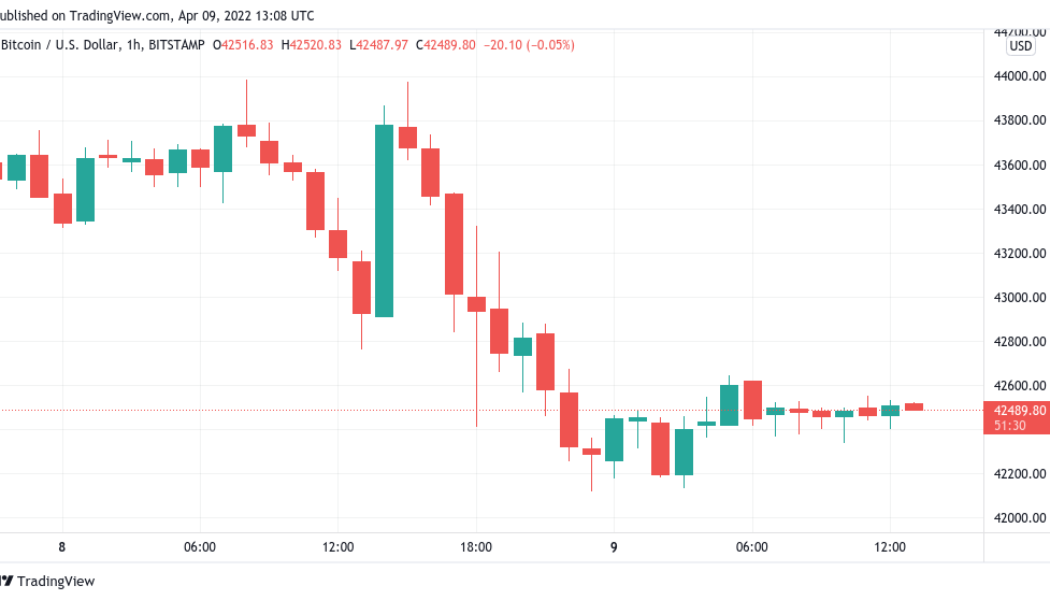

Bitcoin whales fill their bags despite warnings BTC price could fall below $40K
Bitcoin (BTC) headed toward $42,000 on April 9 after bulls failed to spark a late-week turnaround. BTC/USD 1-hour candle chart (Bitstamp). Source: TradingView Bitcoin lines up 10% weekly red candle Data from Cointelegraph Markets Pro and TradingView showed BTC/USD slowly dissolving support levels in place for several weeks as the weekend began. After multiple tests of $43,000, that area finally gave way to see the pair hit lows of $42,131 on Bitstamp, its lowest since March 23. Bulls hoping for a rescue move felt the pain, with cross-crypto liquidations totaling $200 million in the 24 hours to the time of writing Saturday, data from on-chain monitoring resource Coinglass confirmed. Crypto liquidations chart. Source: Coinglass For traders, the short-term outlook was thus firmly bearish...
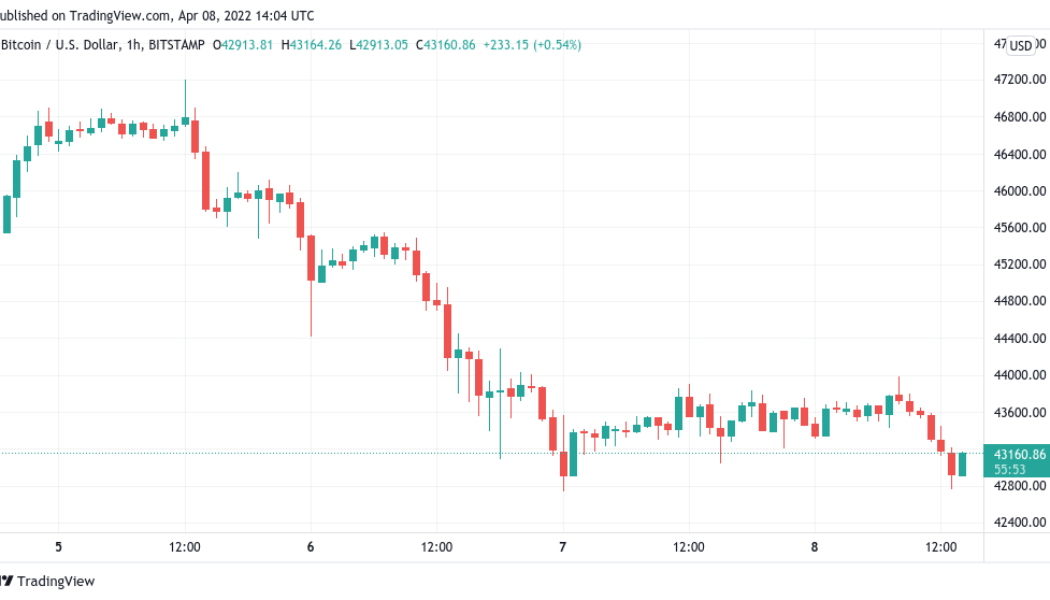

Bitcoin plumbs April lows as US dollar strength hits highest since May 2020
Bitcoin (BTC) neared new price lows for April on April 8’s Wall Street open amid a fresh surge in the U.S. dollar. BTC/USD 1-hour candle chart (Bitstamp). Source: TradingView $43,000 hangs in the balance Data from Cointelegraph Markets Pro and TradingView captured another day of gloom for BTC bulls as the largest cryptocurrency slipped back under $43,000. In a classic move, BTC/USD reacted unfavorably to a resurgent dollar, with the U.S. dollar currency index (DXY) returning above 100 for the first time since May 2020. Coming on the back of tightening measures from the Federal Reserve, the greenback also spelled a headache for stocks, which opened down on the day. U.S. dollar currency index (DXY) 1-week candle chart. Source: TradingView While some considered the DXY event a temp...