Ether

Ethereum ‘shark’ accumulation, Shanghai hard fork put $2K ETH price in play
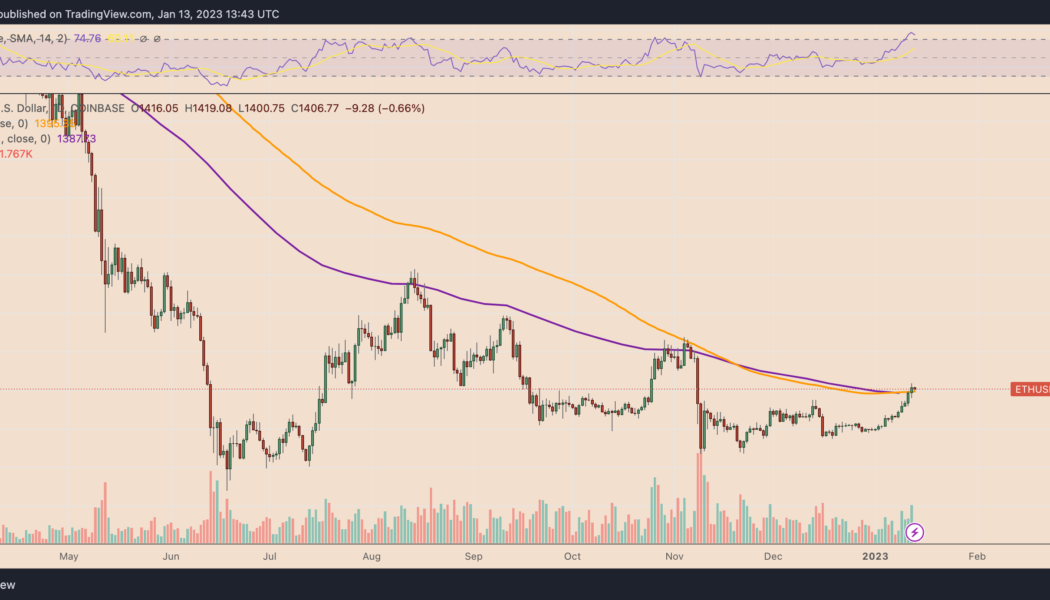
Ether (ETH) price technicals suggest that 35% gains are in play by March 2022 due to several bullish technical and fundamental factors. Ether price rises above two key moving averages On Jan. 8, Ether’s price crossed above its 21-week exponential moving average (21-week EMA; the purple wave) and 200-day simple moving average (200-day SMA; the orange wave). Historically, these two moving averages have separated bull and bear markets. When ETH’s price trades above them, it is considered to be in a bull market, and vice versa. ETH/USD daily price chart featuring 21-week EMA and 200-day SMA. Source: TradingView The last time Ether crossed above its 21-week EMA and 200-day SMA was in April 2022. But this was a fakeout, in part due to the collapse of Terra (LUNA) the following month. B...

Ethereum flashes a classic bullish pattern in its Bitcoin pair, hinting at 50% upside
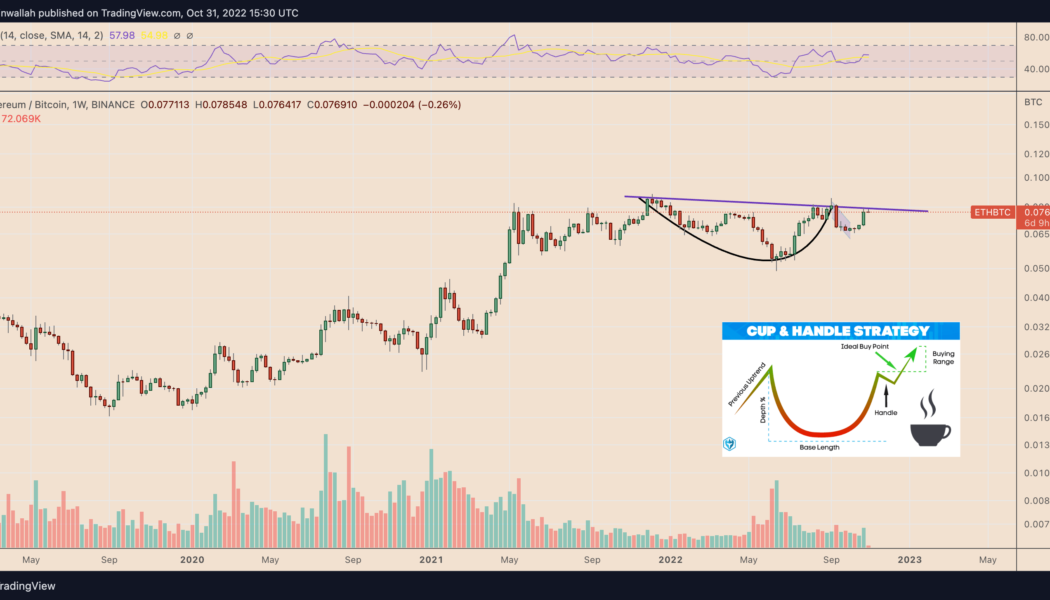
Ethereum’s native token, Ether (ETH), looks poised to log a major price rally versus its top rival, Bitcoin (BTC), in the days leading toward early 2023. Ether has a 61% chance of breaking out versus Bitcoin The bullish cues emerge primarily from a classic technical setup dubbed a “cup-and-handle” pattern. It forms when the price undergoes a U-shaped recovery (cup) followed by a slight downward shift (handle) — all while maintaining a common resistance level (neckline). Traditional analysts perceive the cup and handle as a bullish setup, with veteran Tom Bulkowski noting that the pattern meets its profit target 61% of all time. Theoretically, a cup-and-handle pattern’s profit target is measured by adding the distance between its neckline and lowest point to the neckline level. The Ether-to...

Will ETH price crash to $750? Ethereum daily active addresses plunge to 4-month lows
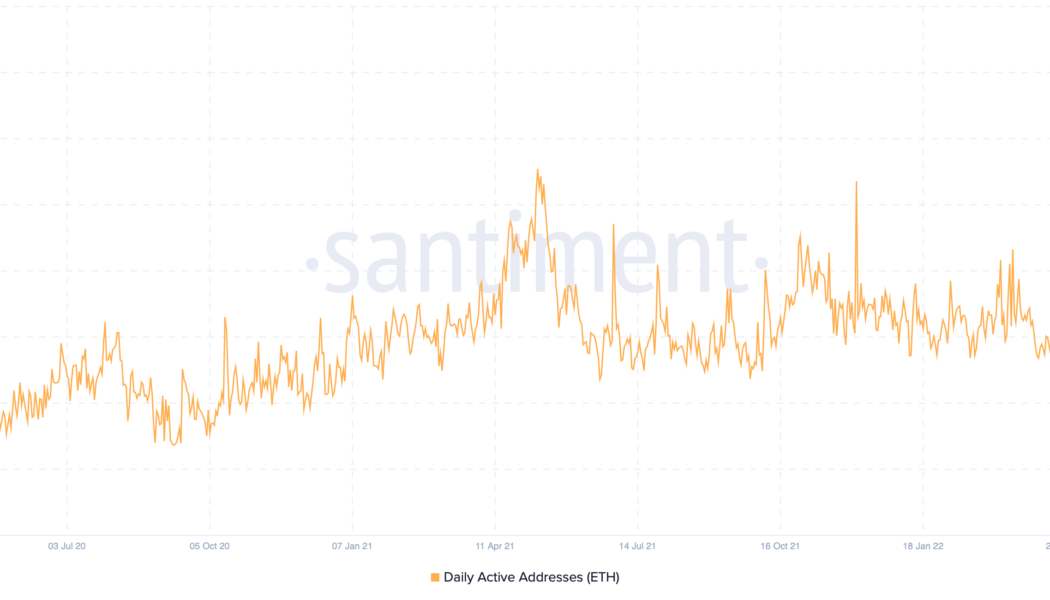
Ethereum has witnessed a substantial drop in its daily active address (DAA) count over the last four months, raising fears about more downside for Ether (ETH) price in the coming weeks. Stagnant Ethereum price spooks investors The number of Ether DAA dropped to 152,000 on Oct. 21, its lowest level since June, according to data provided by Santiment. In other words, the plunge showed fewer unique Ethereum addresses interacting with the network. Ethereum daily active address count on a daily timeframe. Source: Santiment Interestingly, the drop comes after Ether’s 80%-plus correction from its November 2021 high of around $4,850. This coincidence could mean two things: Ethereum users decided to leave the market and/or paused their interaction with the blockchain network after the market’s...

Ethereum risks another 10% drop versus Bitcoin as $15.4M exits ETH investment funds
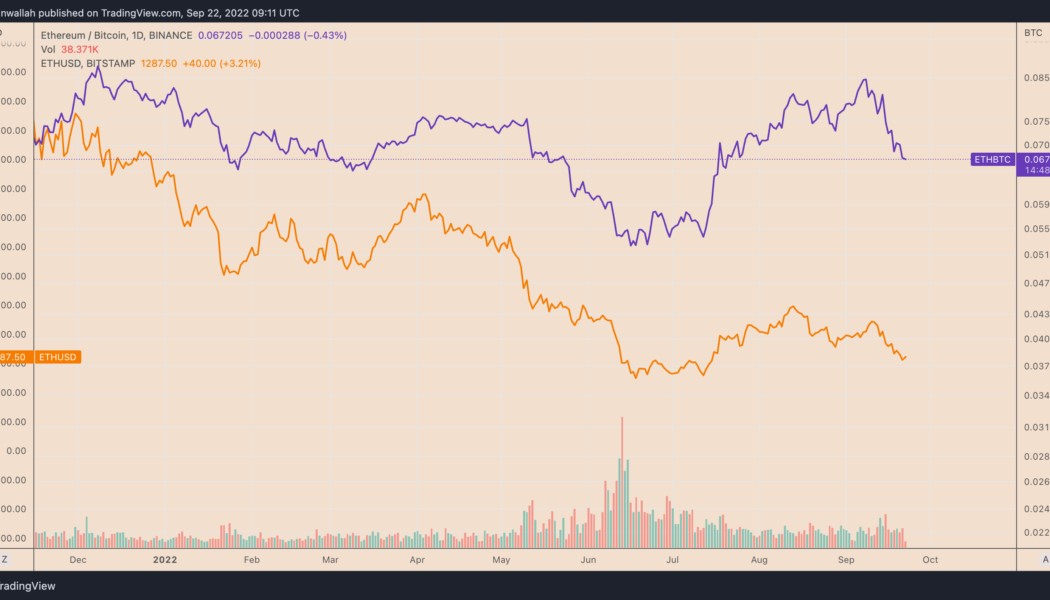
Ethereum’s Merge on Sep. 15 turned out to be a sell-the-news event, which looks set to continue. Notably, Ether (ETH) dropped considerably against the U.S. dollar and Bitcoin (BTC) after the Merge. As of Sep. 22, ETH/USD and ETH/BTC trading pairs were down by more than 20% and 17%, respectively, since Ethereum’s switch to Proof-of-Stake (PoS. ETH/USD and ETH/BTC daily price chart. Source: TradingView What’s eating Ether bulls? Multiple catalysts contributed to Ether’s declines in the said period. First, ETH’s price fall against the dollar appeared in sync with similar declines elsewhere in the crypto market, driven by Federal Reserve’s 75 basis points (bps) rate hike. Second, Ethereum faced a lot of flak for becoming too centralized ...

Surge or purge? Why the Merge may not save Ethereum price from ‘Septembear’
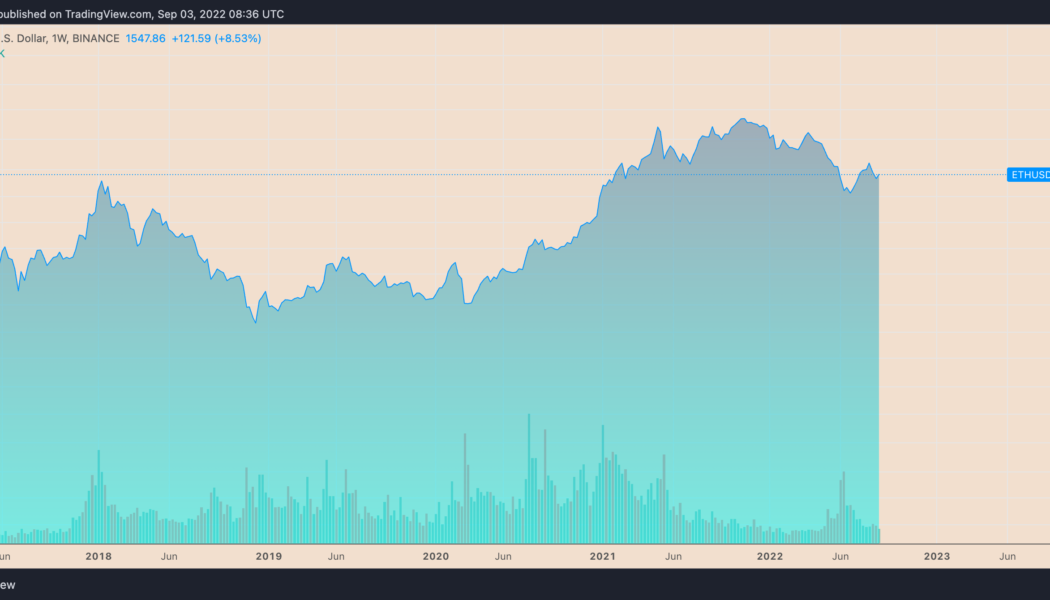
Ethereum’s native token, Ether (ETH), is not immune to downside risk in September after rallying approximately 90% from its bottom of around $880 in June. Much of the token’s upside move is attributed to the Merge, a technical upgrade that would make Ethereum a proof-of-stake (PoS) protocol, slated for Sep. 15. But despite logging impressive gains between June and September, Ether still trades almost 70% below its record high of around $4,950 from November 2021. Therefore, its possibility of heading lower remains on the cards. ETH/USD weekly price chart. Source: TradingView Here are three Ethereum bearish market indicators that show why more downside is likely. Sell the Ethereum Merge news Ethereum options traders anticipate Ether’s price to reach $2,200 f...


NFTs Gaming CEO apologizes for losing 12% of startup capital through crypto trading
According to a recent blog post, 0xfanfaron, CEO of nonfungible tokens (NFTs) gaming project Ragnarok, apologized publicly for his missteps in leading the company. Ragnarok is a crypto startup that brought in $15.5 million worth of Ether (ETH) for gaming development in April through its first-ever NFT sale. However, 0xfanfaron disclosed: “We exchanged the ETH from the mint for 15.5 million in USD Coin. As it turns out, this was a good move in treasury management. But when ETH’s price went down, I made mistakes by buying ETH multiple times when I thought it was an advantageous investment for the project.” 0xfanfaron further elaborated that he sold the firm’s Ether positions through a series of trades with the plan to reinvest at a “better time.” The ventu...

The battle between crypto bulls and bears shows hope for the future
The blockchain space is seeing some areas of strength despite the perceived downturn in the market. The perpetual futures funding rates for Bitcoin (BTC) and Ether (ETH) have flipped back to positive on major exchanges, which shows bullish sentiment among derivatives traders. In addition, Bitcoin started trading below its cost basis, which has marked previous areas of market bottoms. In contrast, June saw decentralized finance (DeFi) experience a 33% decrease in total value locked and crypto stocks provide a -42.7% average month-over-month return. There is an ongoing battle between bullish and bearish sentiments in different areas of the market. To help cryptocurrency traders maneuver through the battlefield, Cointelegraph Research recently launched its monthly “Investor Insights Rep...

Ethereum Classic soars 100% in nine days outperforming ETH as ‘the Merge’ approaches
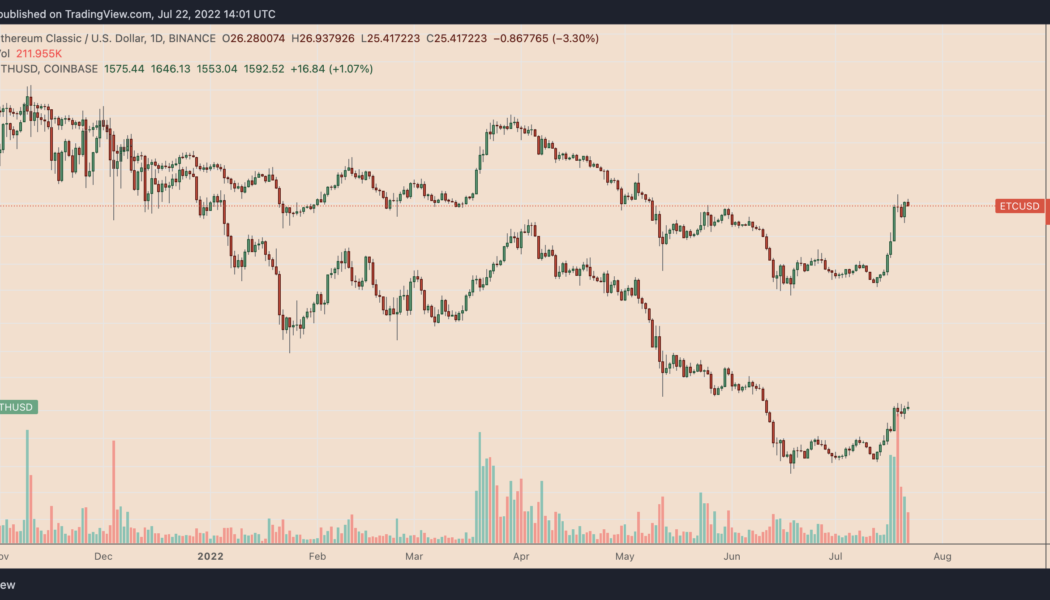
Ethereum Classic (ETC) has been outperforming its arch-rival Ethereum’s native token Ether (ETH) during the current crypto market rebound with the ETC/ETH pairs at 10-month highs. Why is ETC beating ETH? ETC’s price has risen to $27 on July 22, amounting to a 100% gain in nine days after bottoming out at $13.35. Comparatively, ETH’s price has seen a 64% rally in U.S. dollar terms. ETC/USD versus ETH/USD daily price chart. Source: TradingView Ethereum’s rebound has been among the sharpest among the top cryptocurrencies, primarily due to the euphoria surrounding its potential network upgrade in September. Dubbed “the Merge,” the long-awaited technical update will switch Ethereum from proof-of-work (PoW) to proof-of-stake (PoS). Anyone who believes the #Eth...

Ethereum traders gauge fakeout risks after 40% ETH price rally
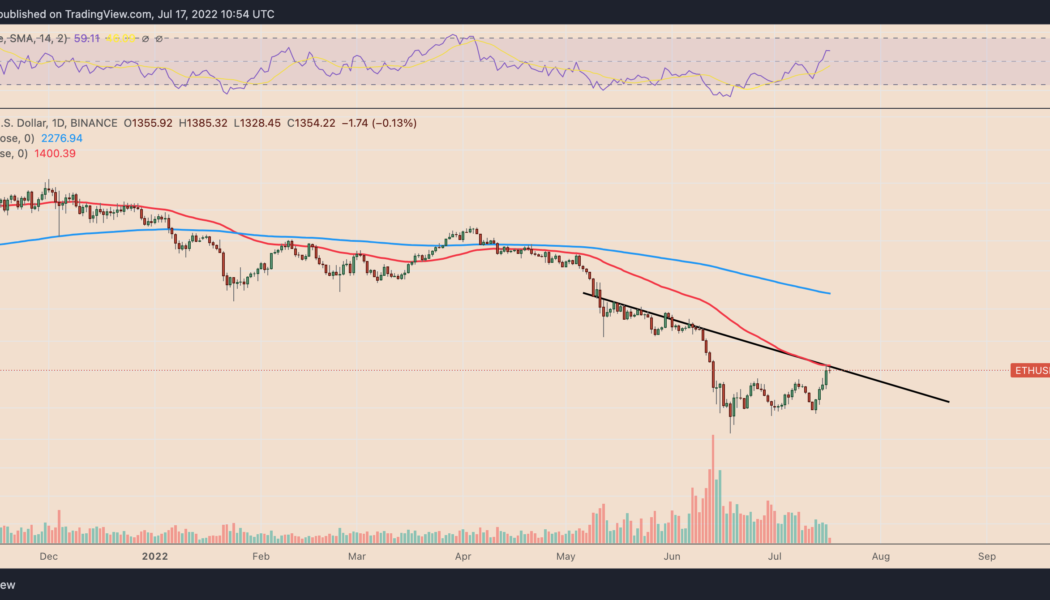
Ethereum’s native token Ether (ETH) saw a modest pullback on July 17 after ramming into a critical technical resistance confluence. Merge-led Ethereum price breakout ETH’s price dropped by 1.8% to $1,328 after struggling to move above two strong resistance levels: the 50-day exponential moving average (5-day EMA; the red wave) and a descending trendline (black) serving as a price ceiling since May. ETH/USD daily price chart. Source: TradingView Previously, Ether rallied by over 40% from $1,000 on July 13 to over $1,400 on July 16. The jump appeared partly due to euphoria surrounding “the Merge” slated for September. Meanwhile, a golden cross’s appearance on Ethereum’s four-hour chart also boosted Ether’s upside sentiment among technical a...

Terra’s LUNA2 skyrockets 70% in nine days despite persistent sell-off risks
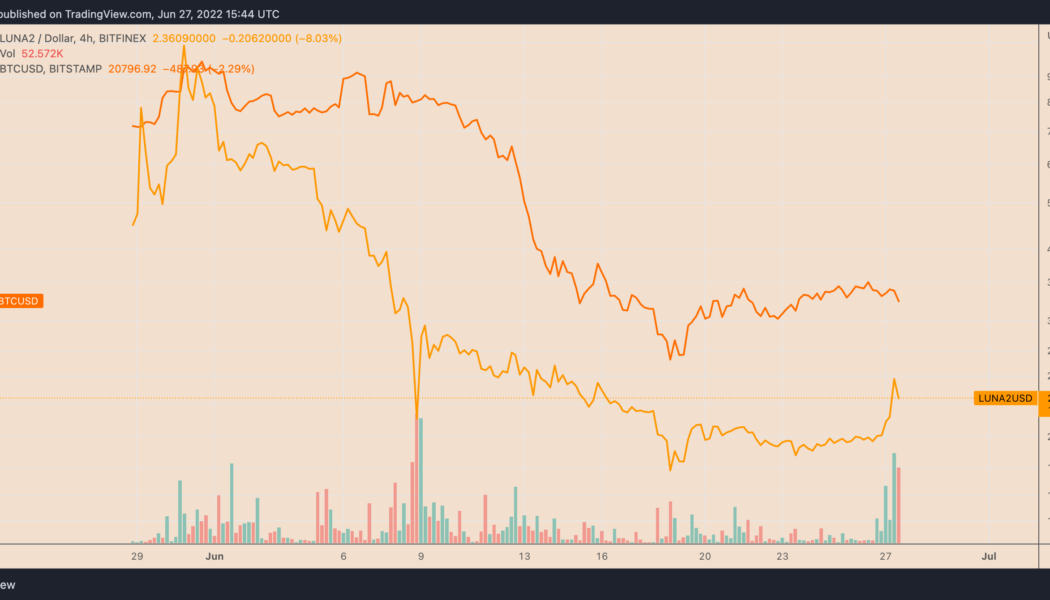
The price of Terra (LUNA2) has recovered sharply nine days after falling to its historic lows of $1.62. On June 27, LUNA2’s rate reached $2.77 per token, thus chalking up a 70% recovery when measured from the said low. Still, the token traded 77.35% lower than its record high of $12.24, set on May 30. LUNA2’s recovery mirrored similar retracement moves elsewhere in the crypto industry with top crypto assets Bitcoin (BTC) and Ether (ETH) rising by approximately 25% and 45% in the same period. LUNA2/USD four-hour price chart versus BTC/USD. Source: TradingView LUNA2 price rally could trap bulls The recent bout of buying in the LUNA2 market could trap bulls, given it has come as a part of a broader correction trend. In detail, LUNA2 appears to be forming a “bear flag&#...

Ethereum price enters ‘oversold’ zone for the first time since November 2018
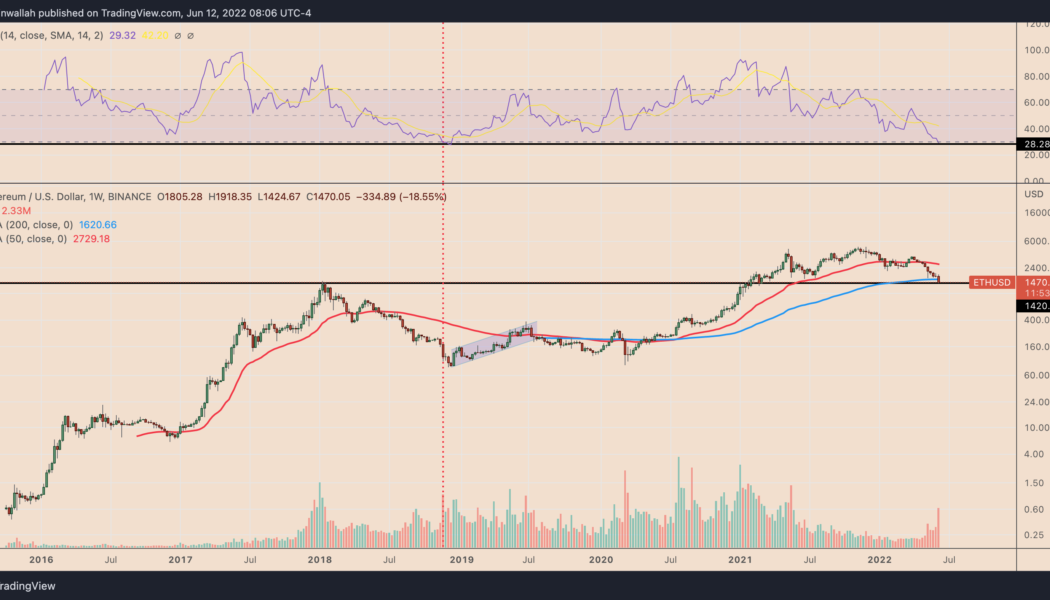
Ethereum’s native token Ether (ETH) entered its “oversold” territory this June 12, for the first time since November 2018, according to its weekly relative strength index (RSI). This is the last time $ETH went oversold on the weekly (hasn’t confirmed here yet). I had no followers, but macro bottom ticked it. Note, you can push way lower on weekly rsi, not trying to catch a bottom. https://t.co/kLCynTKTcS — The Wolf Of All Streets (@scottmelker) June 12, 2022 ETH eyes oversold bounce Traditional analysts consider an asset to be excessively sold after its RSI reading fall below 30. Furthermore, they also see the drop as an opportunity to “buy the dip,” believing an oversold signal would lead to a trend reversal. Ether’s previous oversold reading appeared i...

Ethereum eyes fresh yearly lows vs. Bitcoin as bulls snub successful ‘Merge’ rehearsal
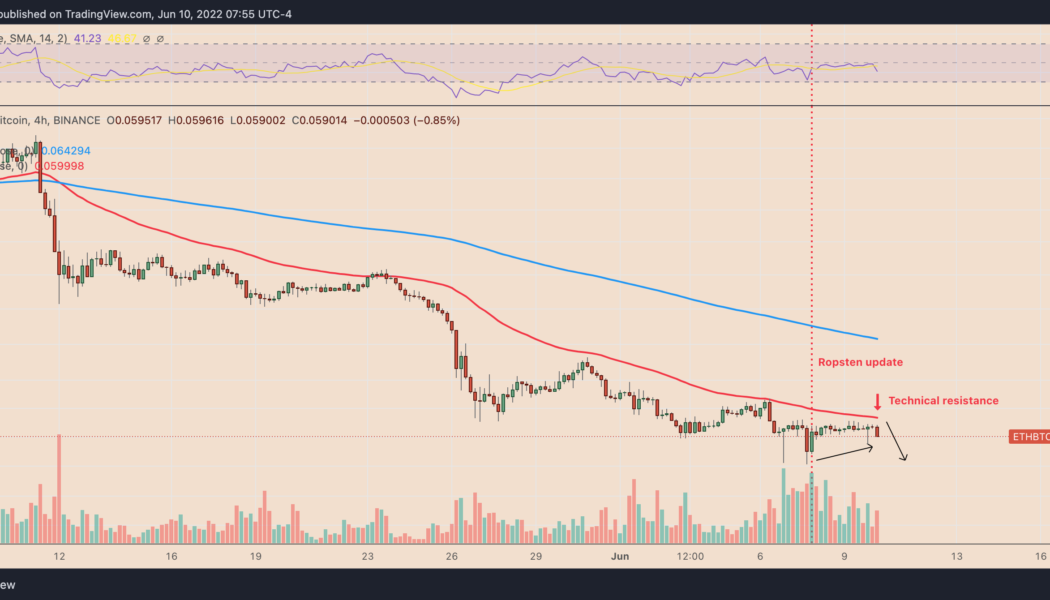
Ethereum’s native token Ether (ETH) resumed its decline against Bitcoin (BTC) two days after a successful rehearsal of its proof-of-stake (PoS) algorithm on its longest-running testnet “Ropsten.” The ETH/BTC fell by 2.5% to 0.0586 on June 10. The pair’s downside move came as a part of a correction that had started a day before when it reached a local peak of 0.0598, hinting at weaker bullish sentiment despite the optimistic “Merge” update. ETH/BTC four-hour price chart. Source: TradingView Interestingly, the selloff occurred near ETH/BTC’s 50-4H exponential moving average (50-4H EMA; the red wave) around 0.06. This technical resistance has been capping the pair’s bullish attempts since May 12, as shown in the chart above. Staked Ether behind ...