Technical Analysis
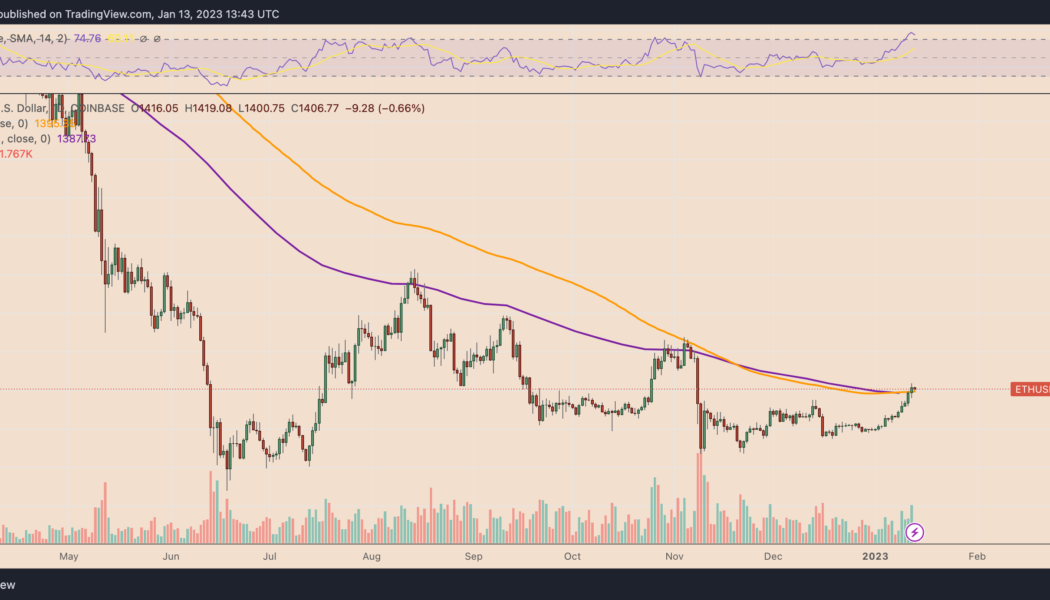

Ethereum ‘shark’ accumulation, Shanghai hard fork put $2K ETH price in play
Ether (ETH) price technicals suggest that 35% gains are in play by March 2022 due to several bullish technical and fundamental factors. Ether price rises above two key moving averages On Jan. 8, Ether’s price crossed above its 21-week exponential moving average (21-week EMA; the purple wave) and 200-day simple moving average (200-day SMA; the orange wave). Historically, these two moving averages have separated bull and bear markets. When ETH’s price trades above them, it is considered to be in a bull market, and vice versa. ETH/USD daily price chart featuring 21-week EMA and 200-day SMA. Source: TradingView The last time Ether crossed above its 21-week EMA and 200-day SMA was in April 2022. But this was a fakeout, in part due to the collapse of Terra (LUNA) the following month. B...

These 4 altcoins may attract buyers with Bitcoin stagnating
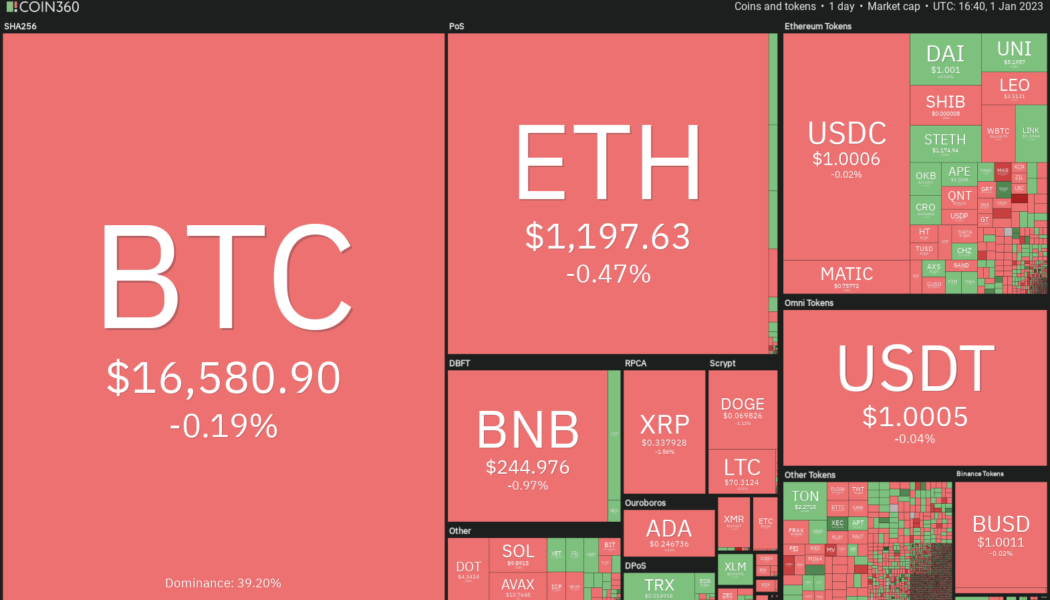
Bitcoin’s (BTC) volatility remained subdued in the final few days of the last year, indicating that investors were in no hurry to enter the markets. Bitcoin ended 2022 near $16,500 and the first day of the new year also failed to ignite the markets. This suggests that traders remain cautious and on the lookout for a catalyst to start the next trending move. Several analysts remain bearish about Bitcoin’s near-term price action. David Marcus, CEO and founder of Bitcoin firm Lightspark, said in a blog post released on Dec. 30 that he does not see the crypto winter ending in 2023 and not even in 2024. He expects that it will take time to rebuild consumer trust but believes the current reset may be good for legitimate firms over the long term. Crypto market data daily view. Source: Coin360 The...

3 reasons why Quant Network’s QNT token may have topped after 450% gains since June
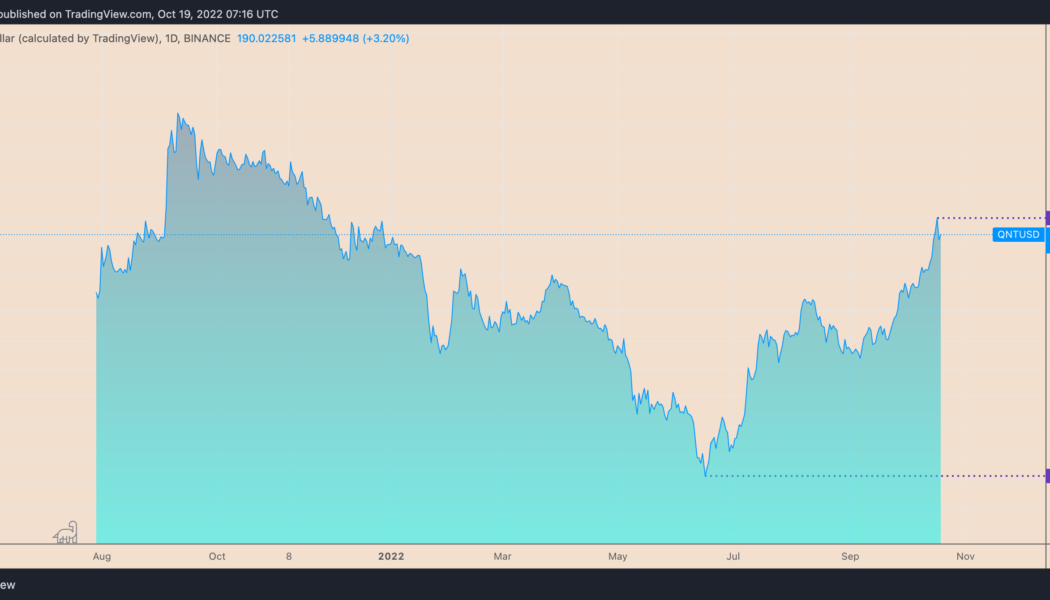
The price of Quant Network (QNT) eyes a sharp reversal after an impressive 450% rally in the past four months. QNT’s downside outlook takes cues from a flurry of technical and on-chain indicators, all suggesting that investors who backed its price rally have likely reached the point of exhaustion. QNT/USD daily price chart. Source: TradingView Here are three reasons why it could be happening. Quant’s daily active addresses drop Interestingly, the period of QNT’s massive uptrend coincided with similar upticks in its number of daily active addresses (DAA). This metric represents the number of unique addresses active on the network as a sender or receiver. As of Oct. 17, the Quant Network’s DAA reached an all-time high of 10,949, up from around 5,850 four months a...

3 signs suggesting the XRP price boom can continue in Q4 2022
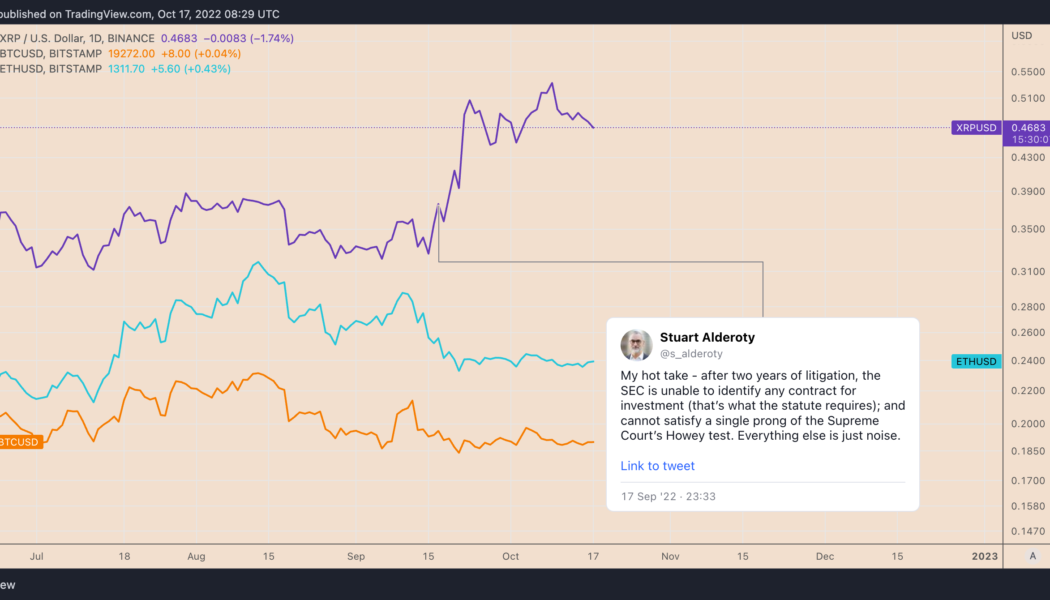
XRP (XRP) has made considerable gains over the past month as traders continue to shower confidence on Ripple’s legal win against the United States Securities and Exchange Commission (SEC). For instance, the XRP price gained 25% thirty days after Ripple and the SEC filed for an immediate ruling on whether or not XRP sales violated U.S. securities laws. In comparison, Bitcoin (BTC) and Ether (ETH) are down 4% and 11% over the same period, respectively. XRP/USD versus BTC/USD and ETH/USD daily price chart. Source: TradingView Now, a flurry of indicators, ranging from on-chain to technical, hints XRP can continue its uptrend going into 2023. XRP price “bull pennant” Bull pennants are bullish continuation patterns that form as the price consolidates in a triangle-like range after...

NEXO risks 50% drop due to regulatory pressure and investor concerns
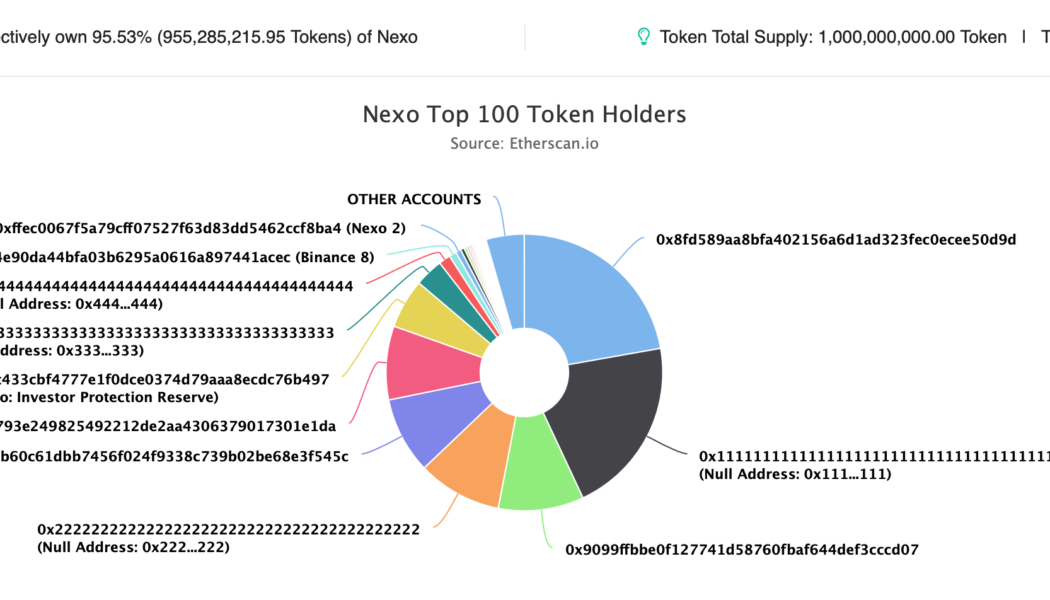
Crypto lending firm Nexo is at risk of losing half of the valuation of its native token by the end of 2022 as doubts about its potential insolvency grow in the market. Is Nexo too centralized? For the unversed: Eight U.S. states filed a cease-and-desist order against Nexo on Sep. 26, alleging that the firm offers unregistered securities to investors without alerting them about the risks of the financial products. In particular, regulators in Kentucky accused Nexo of being insolvent, noting that without its namesake native token, NEXO, the firm’s “liabilities would exceed its assets.” As of July 31, Nexo had 959,089,286 NEXO in its reserves — 95.9% of all tokens in existence. “This is a big, big, big problem because a very basic market analysis demonstrates that Nexo would be...

Goldman Sachs’ bearish macro outlook puts Bitcoin at risk of crashing to $12K
A sequence of macro warnings coming out of the Goldman Sachs camp puts Bitcoin (BTC) at a risk of crashing to $12,000. Bitcoin in “bottom phase?” A team of Goldman Sachs economists led by Jan Hatzius raised their prediction for the speed of Federal Reserve benchmark rate hikes. They noted that the U.S. central bank would increase rates by 0.75% in September and 0.5% in November, up from their previous forecast of 0.5% and 0.25%, respectively. Fed’s rate-hike path has played a key role in determining Bitcoin’s price trends in 2022. The period of higher lending rates — from near zero to the 2.25-2.5% range now — has prompted investors to rotate out of riskier assets and seek shelter in safer alternatives like cash. Bitcoin has dropped by almost 60% year-to-date and is...

Selling the rumor? Biggest Ethereum Merge staker Lido DAO loses 40% in 30 days
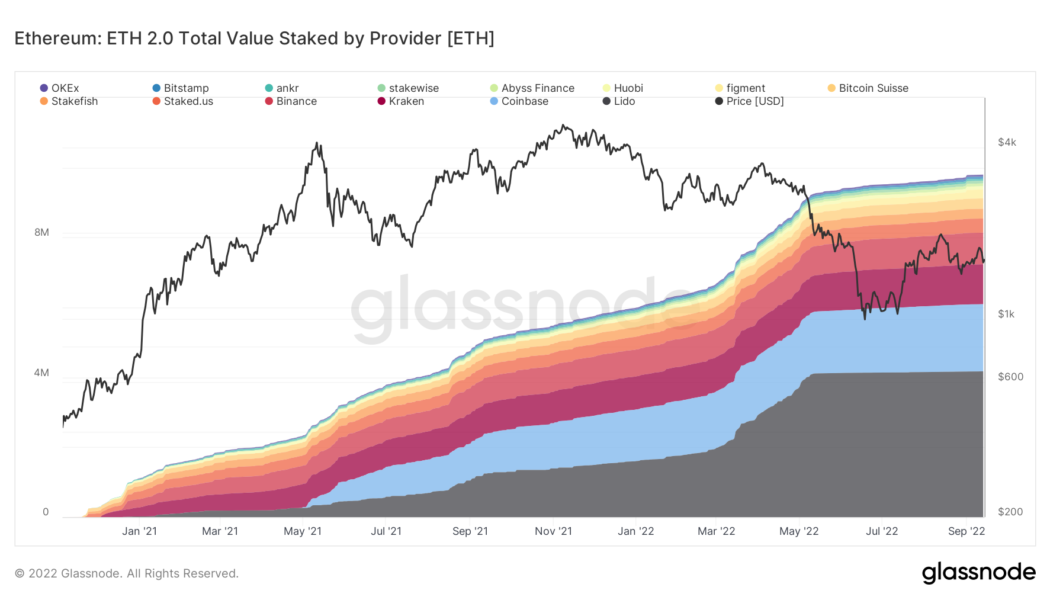
Lido DAO (LDO) has declined by more than 40% in the last 30 days with more room to fall in the coming days amid a potential sell-the-news event, such as the Merge. Lido DAO Ether deposits surge 160% in 2022 Lido DAO is Ethereum’s biggest staking service, having deposited over 4.14 million of the blockchain’s native asset, Ether (ETH), into the Ethereum 2.0 smart contract on behalf of its users, according to the latest data. ETH 2.0 total value staked by provider. Source: Glassnode In comparison, Lido DAO’s total staked amount was around 1.6 million ETH at the beginning of this year. The boom reflects a growing demand for Lido DAO services ahead of Ethereum’s scheduled transition from proof-of-work (PoW) to proof-of-stake (PoS) via the Merge on Sep. 15. LDO, a governance...

Terra back from the dead? LUNA price rises 300% in September
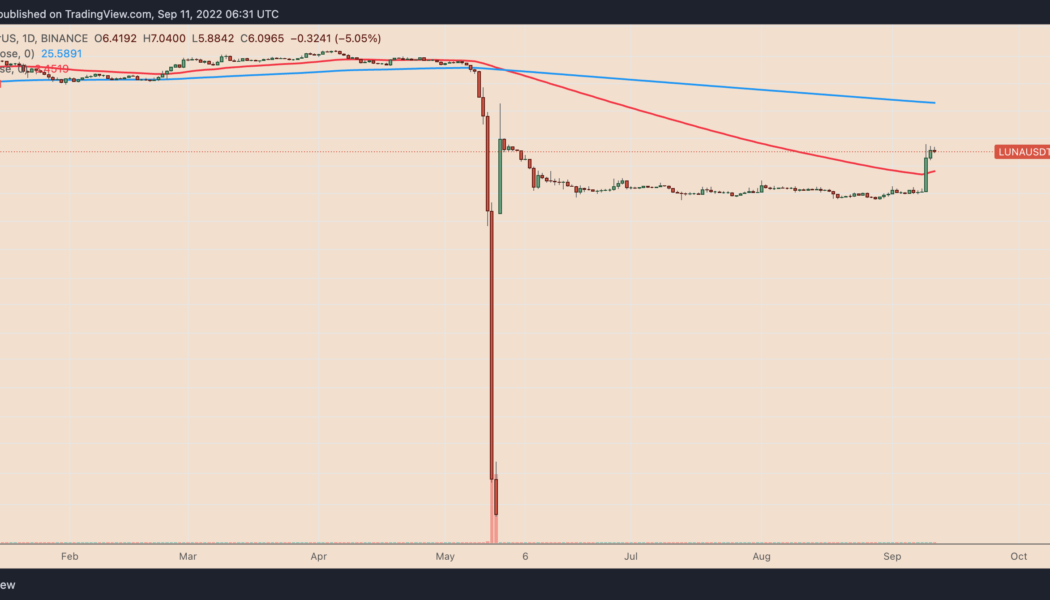
Terra has become a controversial blockchain project after the collapse of its native token LUNA and stablecoin TerraUSD (UST) in May. But its recent gains are hard to ignore for cryptocurrency traders. LUNA rising from the dead? After crashing to nearly zero in May, LUNA is now trading for around $6, a whopping 17,559,000% price rally in less than four months when measured from its lowest level. Meanwhile, LUNA’s performance in September is particularly interesting, given it has rallied by more than 300% month-to-date after a long period of sideways consolidation. LUNA/USDT daily price chart. Source: TradingView Terra ecosystem in September It is vital to note that LUNA also trades with the ticker LUNA2 across multiple exchanges. In detail, Terraform Labs, the firm behind...
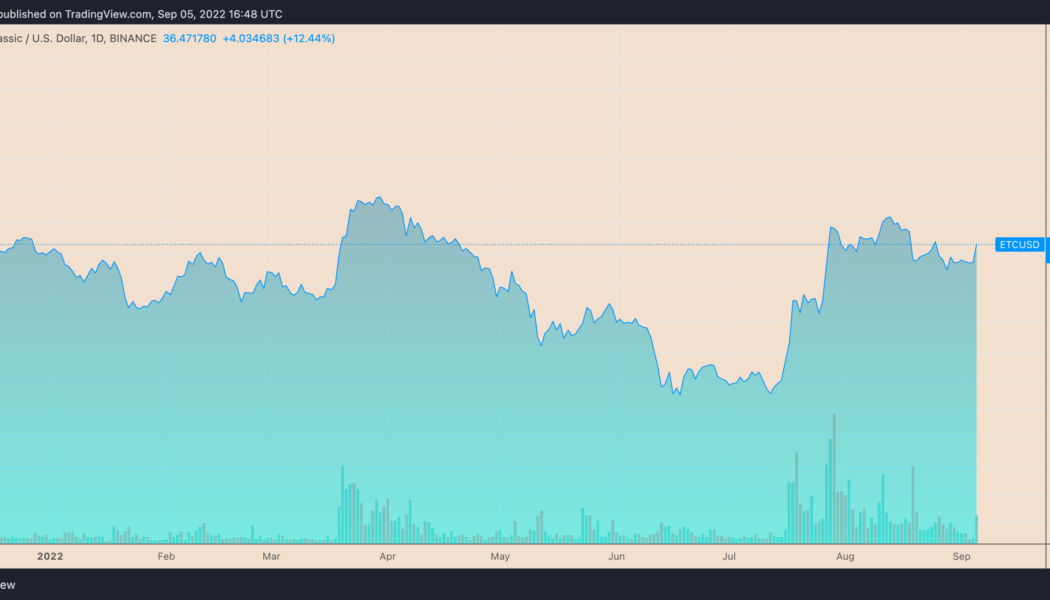

Ethereum Classic books 12% rally as mining support for ETC gains pace
Ethereum Classic (ETC) price rallied on Sept. 5 on back-to-back positive reports concerning its adoption among crypto miners. Top mining pool supports Ethereum Classic On the daily chart, ETC’s price surged 14.5% to nearly $37.25 per token. Its massive gains came days after BTC.com, a blockchain explorer and crypto mining pool, launched a specialized Ethereum Classic pool with “zero-fee” mining for three months. ETC/USD daily price chart. Source: TradingView The announcement appeared after “the Merge,” a long-awaited network update that would switch Ethereum’s energy-intensive proof-of-work (PoW) protocol to a “cost-efficient” and scalable alternative, the proof-of-stake (PoS), on Sept. 19 or before. But the switch to PoS will make Ether...

Surge or purge? Why the Merge may not save Ethereum price from ‘Septembear’
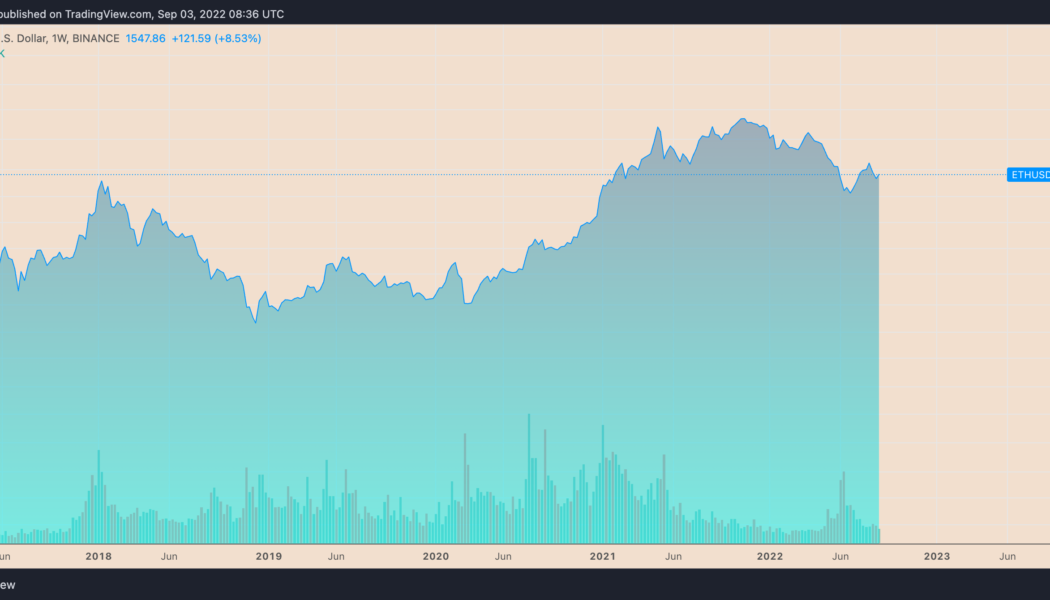
Ethereum’s native token, Ether (ETH), is not immune to downside risk in September after rallying approximately 90% from its bottom of around $880 in June. Much of the token’s upside move is attributed to the Merge, a technical upgrade that would make Ethereum a proof-of-stake (PoS) protocol, slated for Sep. 15. But despite logging impressive gains between June and September, Ether still trades almost 70% below its record high of around $4,950 from November 2021. Therefore, its possibility of heading lower remains on the cards. ETH/USD weekly price chart. Source: TradingView Here are three Ethereum bearish market indicators that show why more downside is likely. Sell the Ethereum Merge news Ethereum options traders anticipate Ether’s price to reach $2,200 f...

XRP price pumps and dumps amid mysterious $51M whale transfers — What’s next?
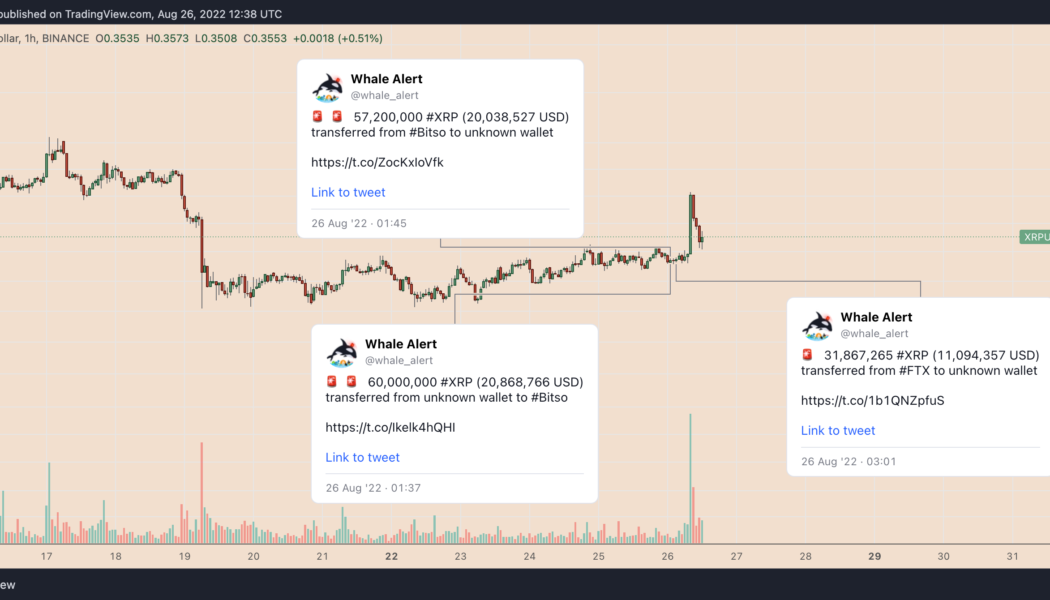
XRP price saw a major spike on Aug. 26, hinting at a possible effect from some big traders. Large XRP transfers, Ripple Swell Global event Notably, XRP’s price jumped 6% to $0.37, a two-week high, during the early London hours. The token’s upside move occurred hours after its network processed three massive transfers worth $51 million involving crypto exchanges Bitso and FTX, as highlighted by Whale Alert. XRP/USD hourly price chart. Source: TradingView XRP’s gains also came as a part of a broader upside move that started on Aug. 25, a day after Ripple announced its flagship event, “Ripple Swell Global,” to be held in London in November 2022. The market has seen similar reactions to the Swell event in the past. Bearish reversal setup in play XRP’s i...

Ominous Solana technicals hint at SOL price crashing 35% by September
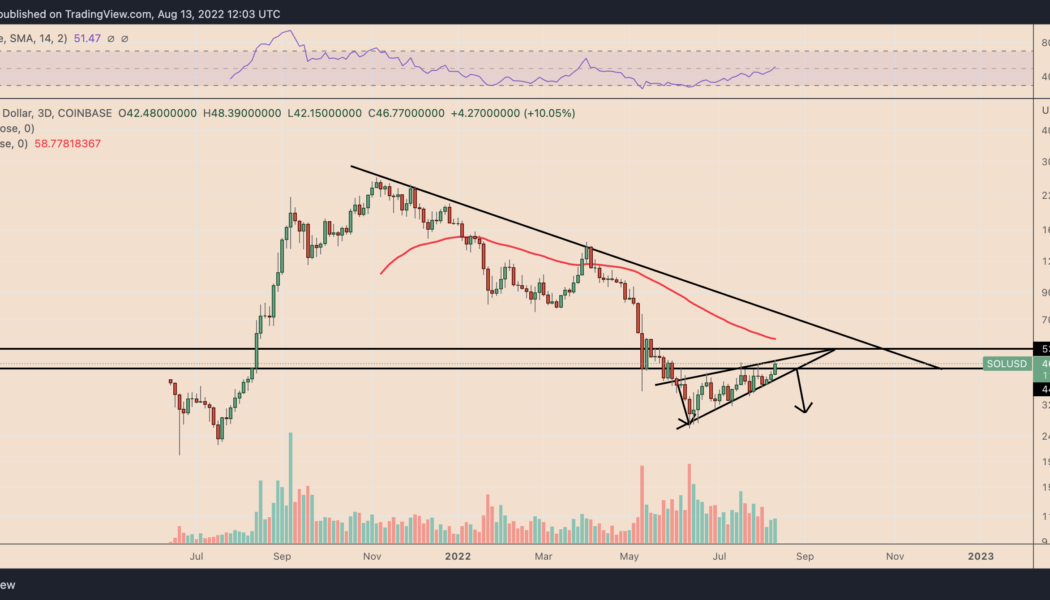
Solana (SOL) risks a significant price correction in the coming weeks owing to a classic bearish reversal setup. A 35% SOL price correction ahead? On the three-day chart, SOL’s price has been painting a rising wedge, confirmed by two ascending, converging trendlines and falling trading volumes in parallel. Rising wedges typically result in breakdown, resolving after the asset’s price break below the lower trendline. If the price follows the breakdown scenario, it could fall by as much as the maximum distance between the wedge’s upper and lower trendline. SOL is far from a breakdown but trades within a falling wedge range, as shown in the chart below. The token eyes an immediate pullback from the wedge’s upper trendline with its interim downside target sitting at the...