LUNA Price
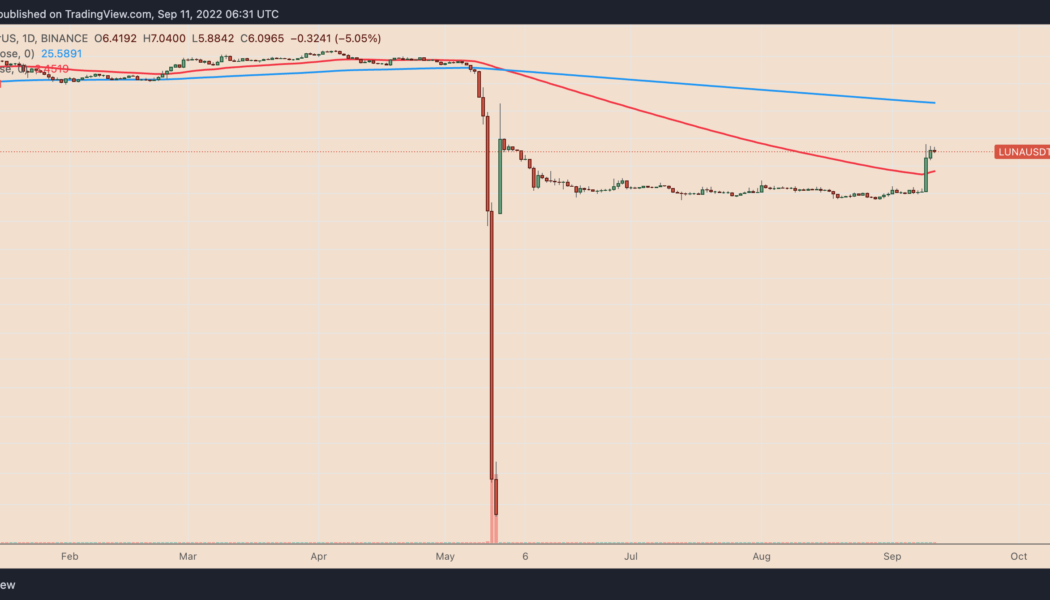

Terra back from the dead? LUNA price rises 300% in September
Terra has become a controversial blockchain project after the collapse of its native token LUNA and stablecoin TerraUSD (UST) in May. But its recent gains are hard to ignore for cryptocurrency traders. LUNA rising from the dead? After crashing to nearly zero in May, LUNA is now trading for around $6, a whopping 17,559,000% price rally in less than four months when measured from its lowest level. Meanwhile, LUNA’s performance in September is particularly interesting, given it has rallied by more than 300% month-to-date after a long period of sideways consolidation. LUNA/USDT daily price chart. Source: TradingView Terra ecosystem in September It is vital to note that LUNA also trades with the ticker LUNA2 across multiple exchanges. In detail, Terraform Labs, the firm behind...

Bitcoin stays under $30K as LUNA gains 600% during ‘insane volatility’
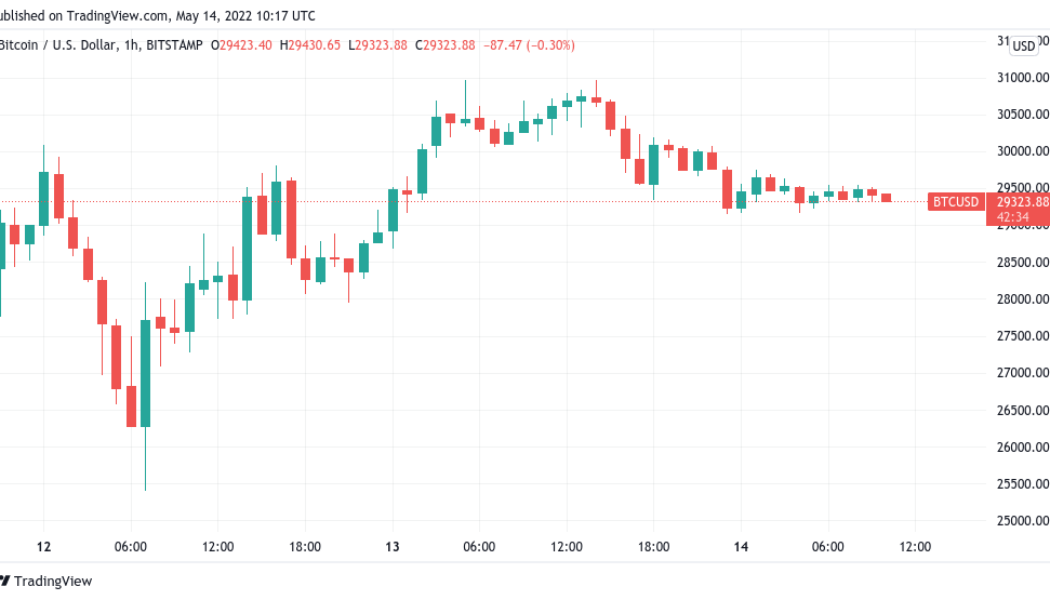
Bitcoin (BTC) failed to reclaim $30,000 into May 14 as traders looked forward to a relatively stable weekend. BTC/USD 1-hour candle chart (Bitstamp). Source: TradingView Bitfinex longs gather strength Data from Cointelegraph Markets Pro and TradingView followed BTC/USD as it lingered below the $30,000 mark, now rapidly becoming resistance. The pair had reached just shy of $31,000 before retracing, while the end of the traditional market trading week had been accompanied by fresh warnings of a new macro low still to come. #Bitcoin – Looks like we might get the inverse H & S before going into the weekend. Hoping to see this 4h candle hold and see it push up. Then I’ll move stops in profit and let it ride during the weekend. 2% risk, 2% stop loss. pic.twitter.com/lxRuk3M43G — ...

Bitcoin falls below $27K to December 2020 lows as Tether stablecoin peg slips under 99 cents
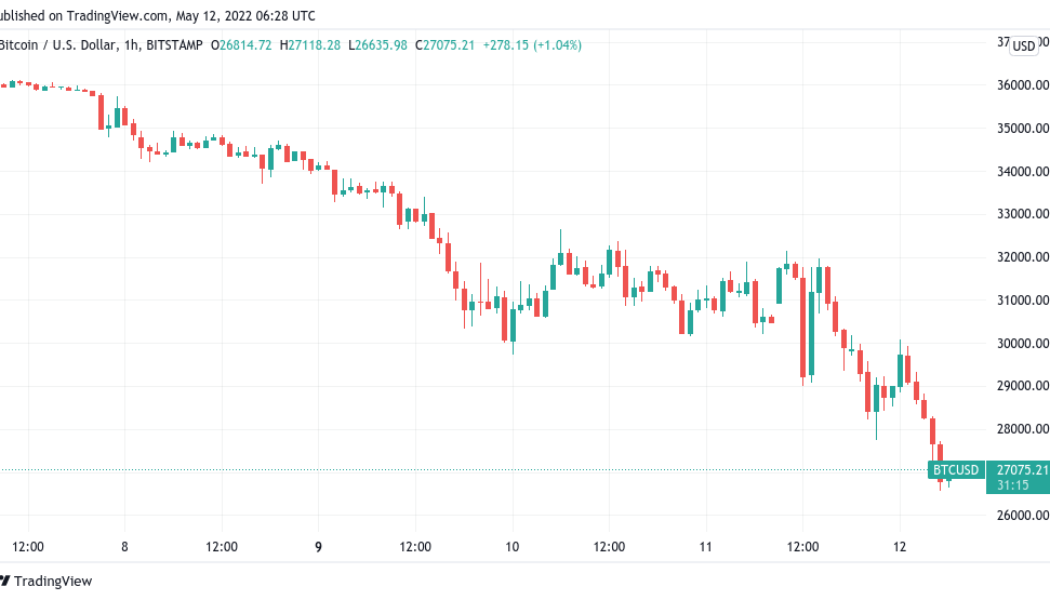
Bitcoin (BTC) fell out of its long-term trading range on May 12 as ongoing sell pressure reduced markets to 2020 levels. BTC/USD 1-hour candle chart (Bitstamp). Source: TradingView Tether wobbles as UST stays under $0.60 Data from Cointelegraph Markets Pro and TradingView followed BTC/USD as it exited the range in which it had traded since the start of 2021. At the time of writing, the pair circled $26,700 on Bitstamp, marking its lowest since Dec 28, 2020. The weakness came as fallout from the Terra stablecoin meltdown continued to ricochet around crypto and beyond, with rumors claiming that even professional funds were experiencing solvency issues due to losses on LUNA and UST. “People are still processing this but this is the Lehman moment for crypto” Hearing about a lo...

Bitcoin plumbs April lows as US dollar strength hits highest since May 2020
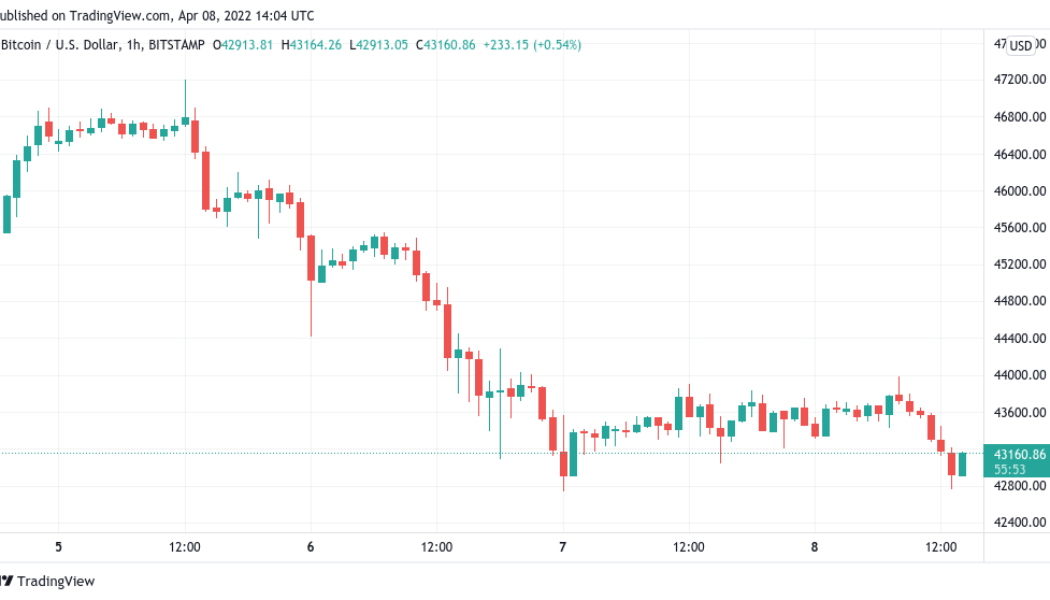
Bitcoin (BTC) neared new price lows for April on April 8’s Wall Street open amid a fresh surge in the U.S. dollar. BTC/USD 1-hour candle chart (Bitstamp). Source: TradingView $43,000 hangs in the balance Data from Cointelegraph Markets Pro and TradingView captured another day of gloom for BTC bulls as the largest cryptocurrency slipped back under $43,000. In a classic move, BTC/USD reacted unfavorably to a resurgent dollar, with the U.S. dollar currency index (DXY) returning above 100 for the first time since May 2020. Coming on the back of tightening measures from the Federal Reserve, the greenback also spelled a headache for stocks, which opened down on the day. U.S. dollar currency index (DXY) 1-week candle chart. Source: TradingView While some considered the DXY event a temp...
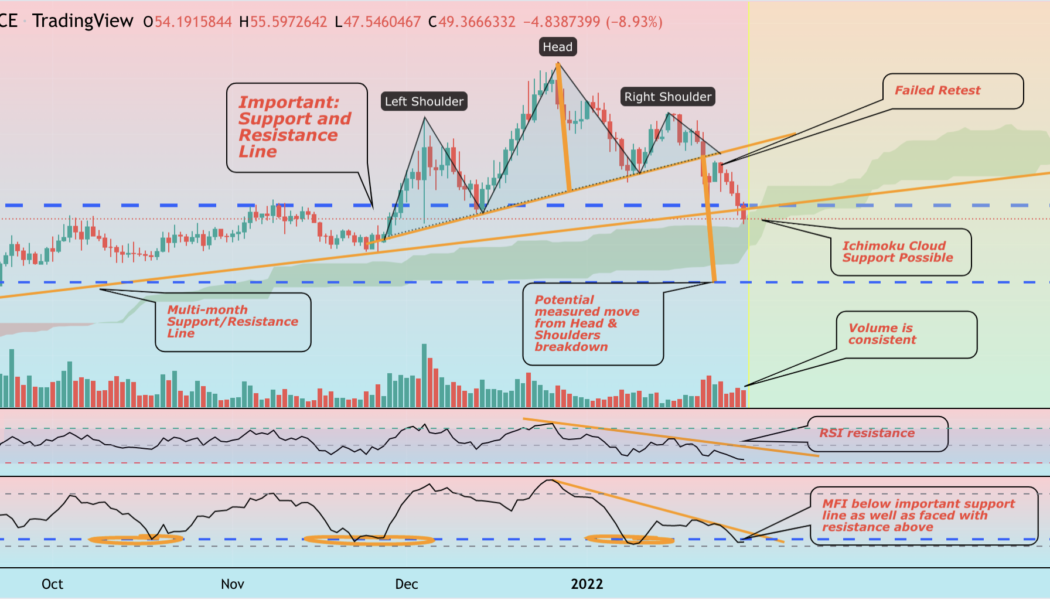

Terra (LUNA) at risk of 50% drop if bearish head-and-shoulders pattern plays out
Terra (LUNA) may fall to nearly $25 per token in the coming weeks as a head-and-shoulders (H&S) setup develops, indicating a 50% price drop, according to technical analysis shared by CRYPTOPIKK. H&S patterns appear when the price forms three peaks in a row, with the middle peak (called the “head”) higher than the other two (left and right shoulders). All three peaks come to a top at a common price floor called the “neckline.” Traders typically look to open a short position when the price breaks below the H&S neckline. However, some employ a “two-day” rule where they wait for the second breakout confirmation when the price retests the neckline from the downside as resistance, before entering a short position. Meanwhile, the ideal short ta...