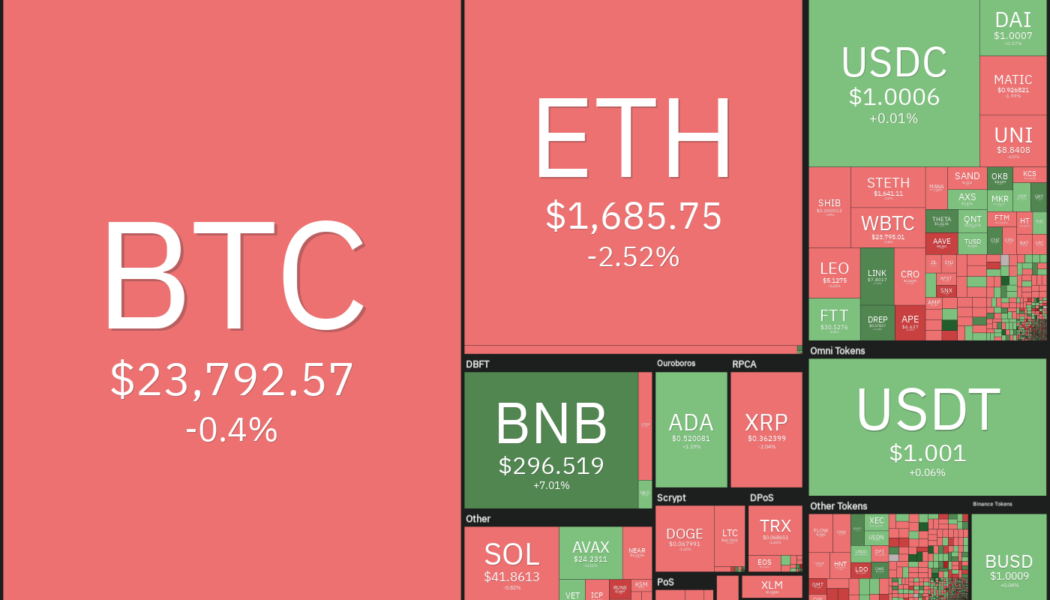
Bitcoin (BTC) hit a six-week high above $24,000 on July 29, extending its rally that picked up momentum after the United States Federal Reserve hiked rates by 75 basis points on July 27. If the rally sustains for the next two days, Bitcoin could be on target to close the month of July with gains of more than 20%, according to data from Coinglass.
It is not only the crypto markets that have seen a post-Federal Open Market Committee (FOMC) rally. The U.S. equities markets are on track for big monthly gains in July. The S&P 500 and the Nasdaq Composite are up about 8.8% and 12% in July, on track to their best monthly gains since November 2020.

The crypto and equities markets have risen in the expectation that the pace of rate hikes by the Fed will slow down in the future. Arthur Hayes, ex-CEO of derivatives platform BitMEX, believes that the Fed will not increase rates further and may eventually return to an accommodative monetary policy and more neutral rates.
Could Bitcoin and altcoins extend their recovery over the next few days? Let’s study the charts of the top 10 cryptocurrencies to find out.
BTC/USDT
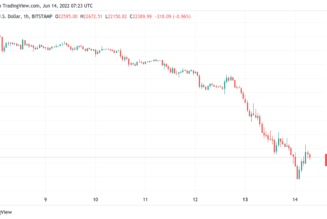
Bitcoin closed below the 20-day exponential moving average (EMA) ($22,213) on July 25 but the bears could not sustain the lower levels. The bulls bought the dip below $21,000 and propelled the price back above the moving averages on July 27.

The moving averages have completed a bullish crossover and the relative strength index (RSI) is in the positive territory, indicating that bulls are in control. If buyers drive the price above $24,276, the BTC/USDT pair could pick up momentum and rally toward the pattern target of $28,171. If this level is crossed, the next stop could be $32,000.
Alternatively, if the price turns down from the current level or fails to sustain above $24,276, it will suggest that demand dries up at higher levels. In that case, the critical level to watch on the downside is the 20-day EMA. If this support cracks, it will suggest that the bullish momentum has weakened. The pair could then decline to the 50-day simple moving average (SMA) ($21,589).
ETH/USDT
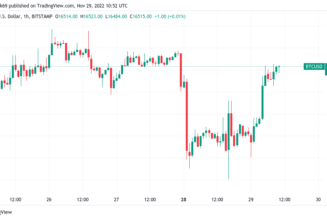
Ether (ETH) rebounded sharply off the 20-day EMA ($1,470) on July 27 and broke above the critical resistance at $1,700 on July 28. However, the bears are not willing to relent and are trying to pull the price back below $1,700 on July 29.

The bulls and bears may engage in a tough battle near $1,700 but the upsloping 20-day EMA and the RSI in the positive zone indicate an advantage to buyers. If bulls sustain the price above $1,700, the momentum could pick up and the ETH/USDT pair could rally to $2,000 and later to $2,200.
Conversely, if bears pull the price below $1,590, aggressive bulls could get trapped and the pair may drop to the 20-day EMA. A strong rebound off this level will increase the possibility of a break above $1,700 but a break below the 20-day EMA could sink the pair to $1,280.
BNB/USDT
BNB has been trading inside an ascending channel for the past few days. The price bounced off the 50-day SMA ($239) on July 26 and rose above the downtrend line, indicating a potential change in trend.

The bullish momentum continued and the buyers have driven the price above the resistance line of the ascending channel. If bulls sustain the price above the channel, the BNB/USDT pair could rally to the overhead resistance at $350.
Alternatively, if bulls fail to sustain the price above the channel, it will suggest that bears are active at higher levels. The pair could then re-enter the channel and drop to the downtrend line. A strong rebound off this level could improve the prospects of a break above the channel. The bears will have to sink the price below the channel to gain the upper hand.
XRP/USDT
Ripple (XRP) is range-bound in a downtrend. The bears pulled the price below the moving averages on July 25 but could not sustain the lower levels and challenge the strong support at $0.30.

This suggests strong demand at lower levels. The buyers pushed the price back above the moving averages on July 27 and are attempting to clear the overhead hurdle at $0.39. If they succeed, it will suggest the start of a new up-move. The pair could then rally to the target objective at $0.48.
Contrary to this assumption, the price has turned down from $0.39. The bears will try to sink the XRP/USDT pair below the moving averages. If they do that, the pair could consolidate between $0.30 and $0.39 for a few more days.
ADA/USDT
The bulls pushed Cardano (ADA) above the moving averages on July 27, indicating strong buying near the $0.44 support. The price has reached the overhead resistance at $0.55, which could act as a stiff barrier.

If the price turns down from $0.55, the ADA/USDT pair could drop to the moving averages. A break below this support could keep the pair range-bound between $0.44 and $0.55 for a few days. The bears will have to sink the pair below the $0.44 to $0.40 support zone to signal the resumption of the downtrend.
Conversely, if bulls thrust the price above $0.55, it will suggest the start of a new up-move. The pair could then rally to $0.63 and later to $0.70.
SOL/USDT
Solana (SOL) rebounded off the support line on July 26, indicating strong buying at lower levels. The bulls built upon the momentum and pushed the price above the moving averages on July 27.

The SOL/USDT pair could reach the overhead resistance at $48, which is an important level to keep an eye on. If bulls overcome this barrier, the pair will complete an ascending triangle pattern. The pair could then start an up-move toward the pattern target at $71.
On the contrary, if the price turns down from $48, the pair may extend its stay inside the triangle for a few more days. A break and close below the support line could tilt the advantage in favor of the bears.
DOGE/USDT
Dogecoin (DOGE) bounced off the trendline of the ascending triangle pattern on July 27 and rose above the moving averages. This indicates strong demand at lower levels.

The bulls will now try to push the price toward the overhead resistance at $0.08. The moving averages have completed a bullish crossover and the RSI has jumped into the positive territory indicating advantage to buyers.
If bulls drive the price above $0.08, the bullish setup will complete and the DOGE/USDT pair could rally to the pattern target of $0.11. The bears will have to sink the price below the trendline of the triangle to invalidate the bullish view.
Related: Bitcoin bear market over, metric hints as BTC exchange balances hit 4-year low
DOT/USDT
Polkadot (DOT) turned up and broke above the moving averages on July 27, indicating that lower levels are attracting buyers. The price has reached the strong overhead resistance at $8.50 where the bears may mount a strong defense.

The moving averages are on the verge of a bullish crossover and the RSI is in the positive territory, indicating that the bears may be losing their grip. If bulls push and sustain the price above $8.50, it will suggest the start of a new up-move to $10 and later to $10.80.
Contrary to this assumption, if the price turns down from $8.50 and slips below the moving averages, it will suggest that the DOT/USDT pair may oscillate inside a range for a few more days. The bears will have to sink the pair below $6 to start the next leg of the downtrend.
MATIC/USDT
Polygon (MATIC) bounced off the 20-day EMA ($0.79) on July 26 and rose above the downtrend line on July 27. This indicated that the minor corrective phase was over.

The bulls pushed the price to $0.98 on July 28 and 29 but the long wick on the candlesticks suggests that the bears are defending the level with vigor. The upsloping 20-day EMA and the RSI in the positive territory indicate that the path of least resistance is to the upside.
If bulls push the price above the psychological level of $1, the MATIC/USDT pair could extend its rally to $1.26. This bullish view could be invalidated in the near term if the price turns down and breaks below the 20-day EMA.
AVAX/USDT
Avalanche (AVAX) rebounded off the 50-day SMA ($19.48) on July 26 and is nearing the overhead resistance at $26.38 on July 29. The bears will try to stall the recovery at this level.

The gradually upsloping 20-day EMA ($22.10) and the RSI in the positive territory indicate an advantage to buyers. If bulls drive the price above $26.38, the bullish momentum could pick up and the AVAX/USDT pair could rally to $33 and then to $38.
Contrary to this assumption, if the price turns down from $26.38 and breaks below the 20-day EMA, the bears will make one more attempt to sink the pair below the 50-day SMA and challenge the support line.
The views and opinions expressed here are solely those of the author and do not necessarily reflect the views of Cointelegraph. Every investment and trading move involves risk. You should conduct your own research when making a decision.
Market data is provided by HitBTC exchange.
 [flexi-common-toolbar] [flexi-form class=”flexi_form_style” title=”Submit to Flexi” name=”my_form” ajax=”true”][flexi-form-tag type=”post_title” class=”fl-input” title=”Title” value=”” required=”true”][flexi-form-tag type=”category” title=”Select category”][flexi-form-tag type=”tag” title=”Insert tag”][flexi-form-tag type=”article” class=”fl-textarea” title=”Description” ][flexi-form-tag type=”file” title=”Select file” required=”true”][flexi-form-tag type=”submit” name=”submit” value=”Submit Now”] [/flexi-form]


Tagged: Avalanche, Binance Coin, Bitcoin, Cardano, crypto blog, Crypto news, Dogecoin, Ethereum, Markets, Polkadot, polygon, Price analysis, Ripple, Solana