Crypto market

Ethereum ‘shark’ accumulation, Shanghai hard fork put $2K ETH price in play
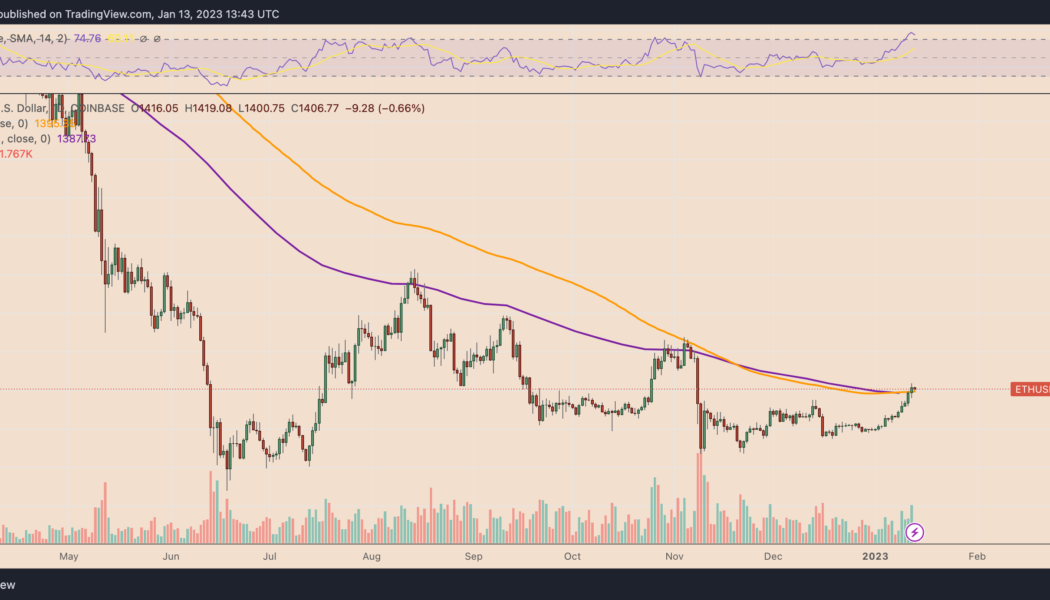
Ether (ETH) price technicals suggest that 35% gains are in play by March 2022 due to several bullish technical and fundamental factors. Ether price rises above two key moving averages On Jan. 8, Ether’s price crossed above its 21-week exponential moving average (21-week EMA; the purple wave) and 200-day simple moving average (200-day SMA; the orange wave). Historically, these two moving averages have separated bull and bear markets. When ETH’s price trades above them, it is considered to be in a bull market, and vice versa. ETH/USD daily price chart featuring 21-week EMA and 200-day SMA. Source: TradingView The last time Ether crossed above its 21-week EMA and 200-day SMA was in April 2022. But this was a fakeout, in part due to the collapse of Terra (LUNA) the following month. B...

Why is Ethereum (ETH) price up today?
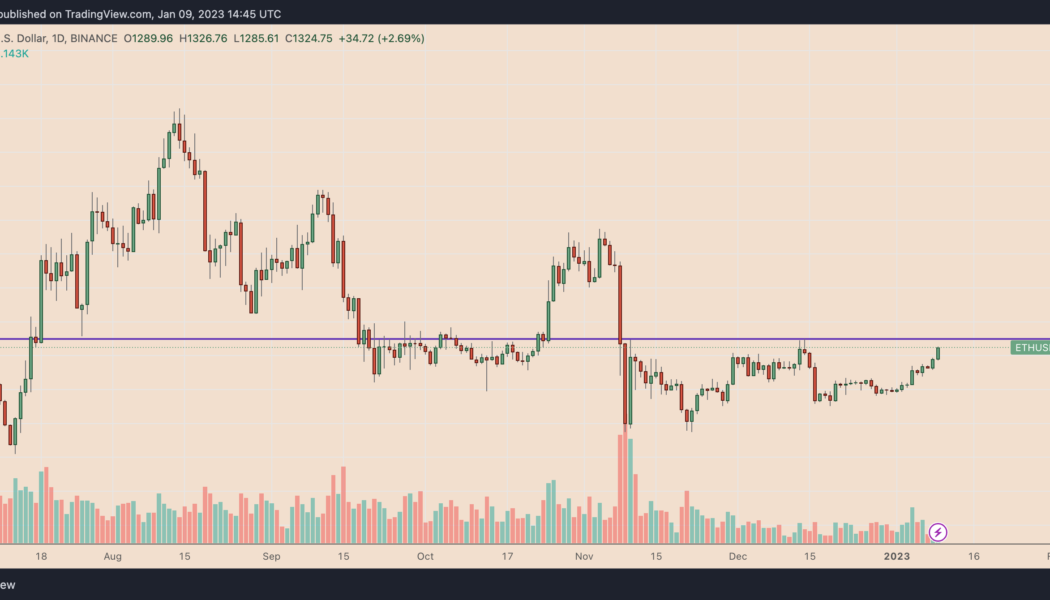
Ethereum’s native token, Ether (ETH), rose to three-week highs, rallying in lockstep with the broader cryptocurrency market, as well as stocks. ETH price rises to three-week highs On Jan. 9, ETH’s price rose 2.85% to cross above $1,325 for the first time in three weeks, a key level that could pave the token’s path toward $1,350 next if its previous price performance is any indication. The crypto market’s capitalization gained 2.66%, or $21.18 billion, in the same period. ETH/USD daily price chart. Source: TradingView Cooling inflation boosts Ethereum price Investors are rushing into riskier markets on signs of cooling inflation. Notably, on Jan. 6, the U.S. Labor Department’s nonfarm payrolls report showed a slowdown in wage increases, w...

Solana joins ranks of FTT, LUNA with SOL price down 97% from peak — Is a rebound possible?
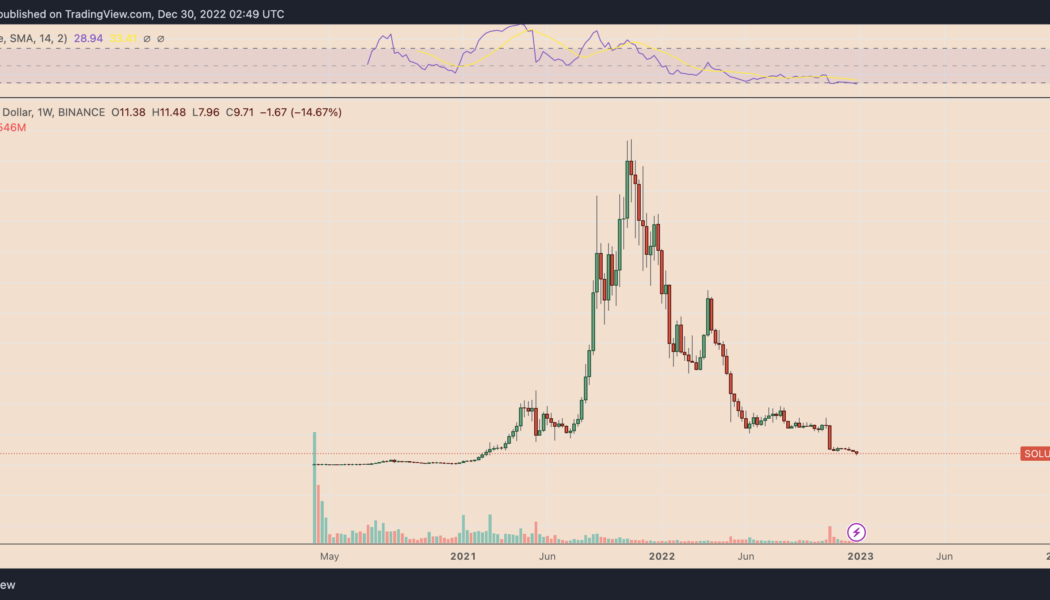
Solana (SOL), the cryptocurrency once supported by Sam Bankman-Fried, pared some losses on Dec. 30, a day after falling to its lowest level since February 2021. Solana price down 97% from November 2021 peak On the daily chart, SOL’s price rebounded to around $10.25, up over 20% from its previous day’s low of approximately $8. SOL/USD weekly price chart. Source: TradingView Nevertheless, the intraday recovery did little to offset the overall bear trend — down 97% from its record peak of $267.50 in November 2021, and down over 20% in the past week. But while the year has been brutal for markets, Solana now joins the ranks of the worst-performing tokens of 2022, namely FTX Token and LUNA, which are down around 98%. FTT (red) vs. LUNA (green) vs. SOL (blue) ...

DeFi token AAVE faces major correction after soaring 100% in a month
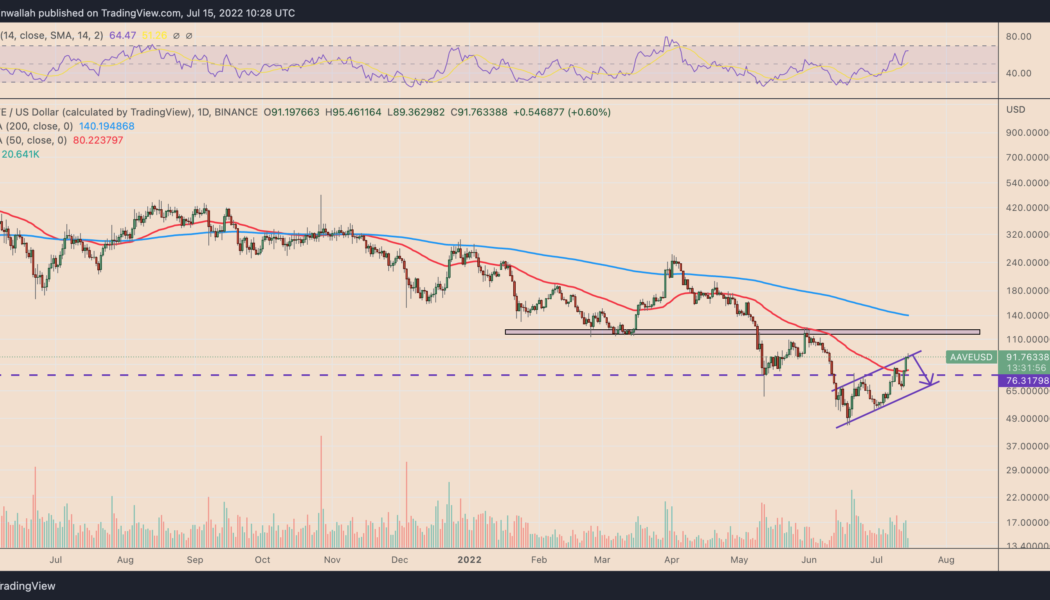
The price of Aave (AAVE) has more than doubled in a month, but its bullish momentum could be reaching a point of exhaustion. AAVE price tests key inflection level Notably, AAVE has surged by over 103% after bottoming out locally at $45.60 on June 18, hitting almost $95.50 this July 15. Nevertheless, the token’s sharp upside retracement move has brought its price closer to the level that triggered equally sharp pullbacks since early June. In other words, AAVE has been testing an ascending trendline resistance that constitutes a “bear flag,” a bearish continuation pattern. For example, the trendline’s previous test on July 9 ended up in a 20% downside move. Similarly, a similar attempt on June 24 pushed AAVE price lower by nearly 30%. AAVE/USD daily price chart. ...
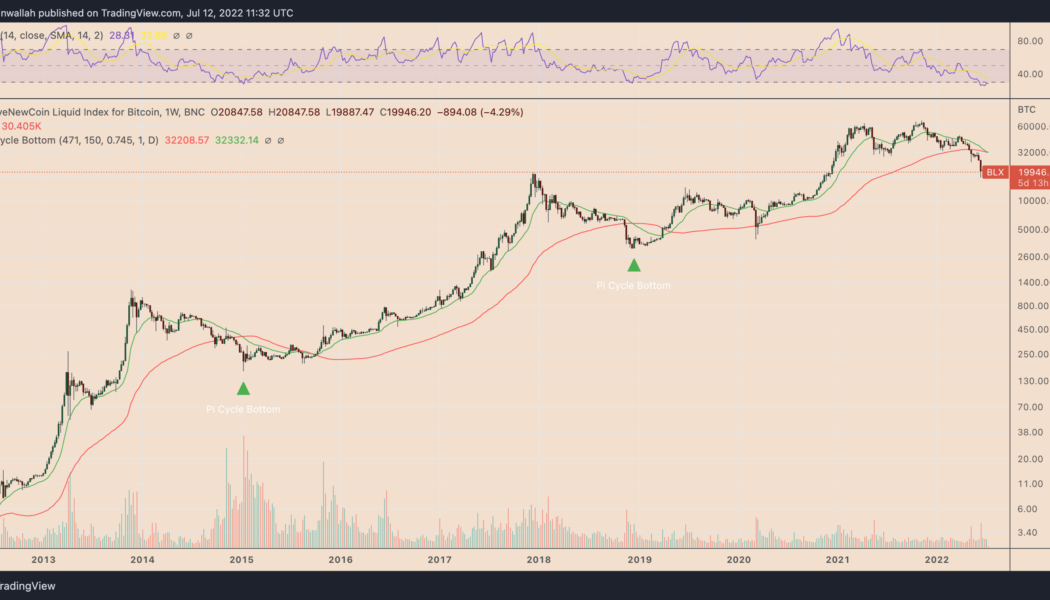

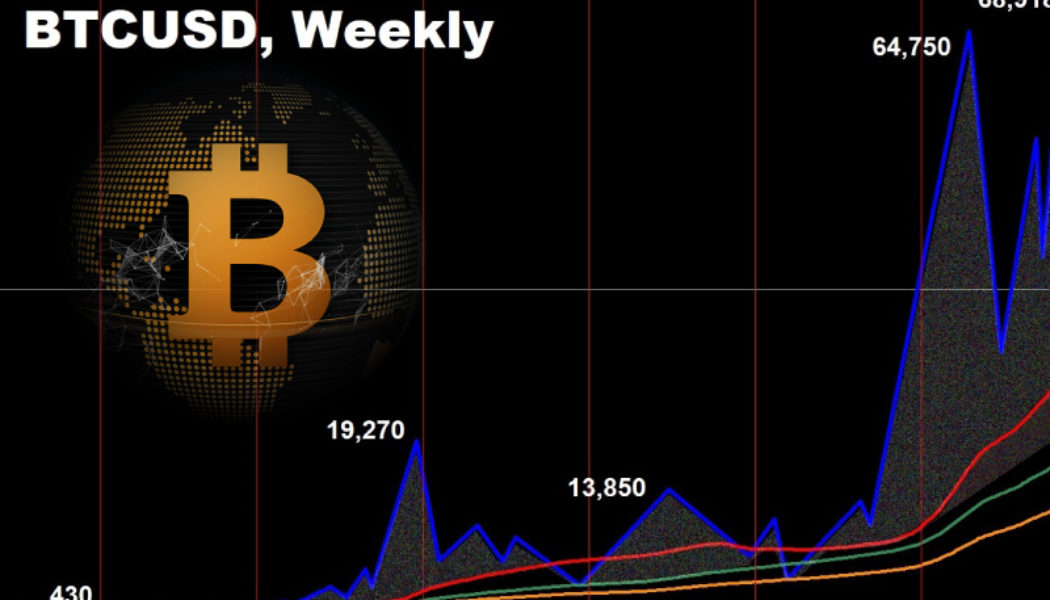
Bitcoin price indicator that marked 2015 and 2018 bottoms is flashing
Bitcoin (BTC) could undergo a massive price recovery in the coming months, based on an indicator that marked the 2015 and 2018 bear market bottoms. What’s the Bitcoin Pi Cycle bottom indicator? Dubbed “Pi Cycle bottom,” the indicator comprises a 471-day simple moving average (SMA) and a 150-period exponential moving average (EMA). Furthermore, the 471-day SMA is multiplied by 0.745; the outcome is pitted against the 150-day EMA to predict the underlying market’s bottom. Notably, each time the 150-period EMA has fallen below the 471-period SMA, it has marked the end of a Bitcoin bear market. For instance, in 2015, the crossover coincided with Bitcoin bottoming out near $160 in January 2015, followed by an almost 12,000% bull run toward $20,000 in December 2017....


Moody’s downgrades Coinbase due to bear: Warns it may not be the last
Credit ratings agency Moody’s has downgraded the Corporate Family Rating (CFR) and guaranteed senior unsecured notes of crypto exchange Coinbase, and stated that both ratings have been placed under review for further downgrade. The CFR, a rating assigned to reflect Moody’s opinion of a company’s ability to honor its financial obligations, was downgraded from Ba2 to Ba3 which is considered as below non-investment grade. Senior unsecured notes are a type of debt a company holds that is not backed by any assets and in the event of bankruptcy must be repaid before any others. Moody’s downgraded Coinbase’s from Ba1 to Ba2. Earlier in May, Cointelegraph reported Coinbase’s junk bonds tanked in response to an underwhelming first quarter and since the report, the bonds have continued to fall a fur...

Illicit crypto usage as a percent of total usage has fallen: Report
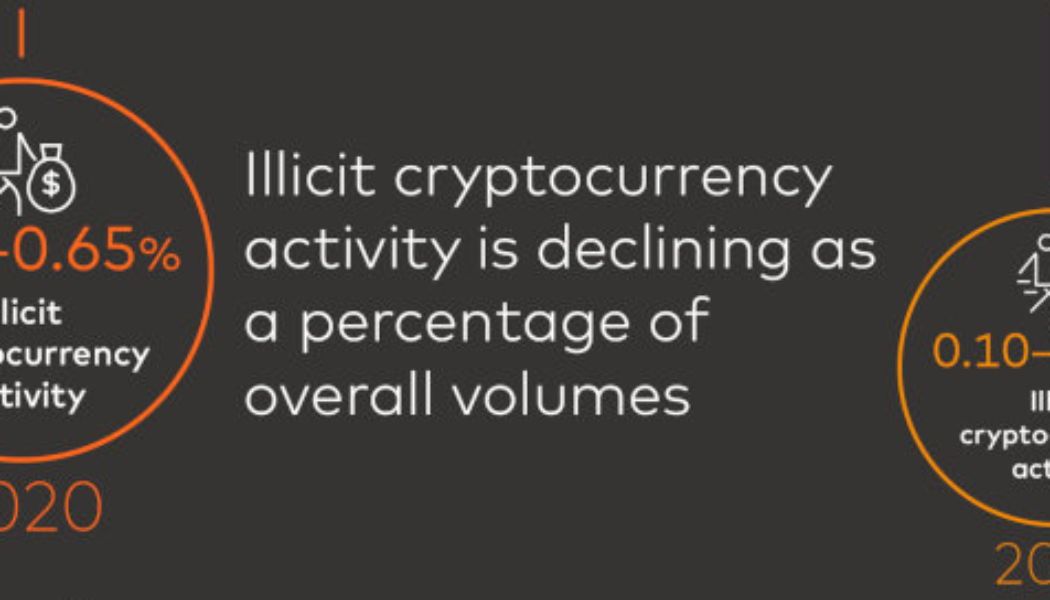
Illicit cryptocurrency activity in 2021 and the first quarter of 2022 has declined as a percentage of overall crypto activity, according to blockchain forensics firm CipherTrace. The cryptocurrency industry has long held a reputation in some jurisdictions as a haven for illegal activity. However, CipherTrace estimates that illicit activity was between 0.62% and 0.65% of overall cryptocurrency activity in 2020. The firm reported that it has now fallen to between 0.10% and 0.15% of overall activity in 2021. Source: CipherTrace In its Cryptocurrency Crime and Anti-Money Laundering Report released June 13, CipherTrace outlined that the top ten decentralized finance (DeFi) hacks in 2021 and Q1 2022 netted attackers $2.4 billion. Over half of that figure came from just two events, the largest be...
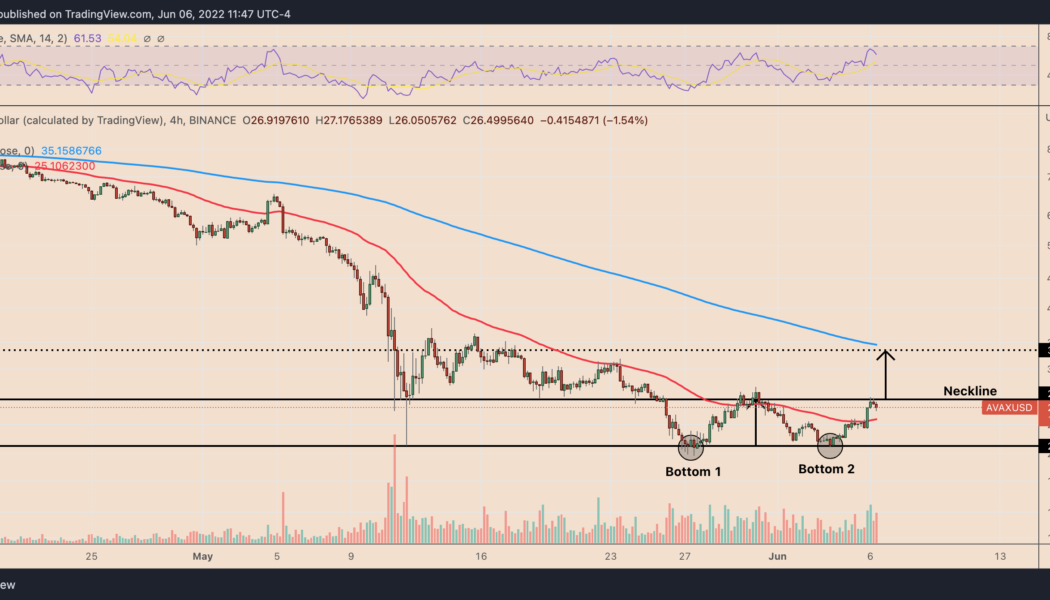

Avalanche price eyes 30% jump in June with AVAX’s classic bullish reversal pattern
Avalanche (AVAX) shows signs of continuing its ongoing rebound move as it paints a classic bullish reversal pattern. AVAX price to $35? Dubbed as “double bottom,” the pattern appears when the price establishes a support level, rebounds, corrects after finding a resistance level, pulls back toward the previous support and bounces back toward the resistance level to pursue a breakout. Since May 27, AVAX’s price trends appear like those typically witnessed during the double bottom formation. Specifically, the AVAX/USD pair on the four-hour chart has bounced twice after testing the same support level near $22.25, and now eyes a breakout above its resistance level — also called “neckline” — near $27.50. AVAX/USD four-hour price chart with “double bottom'...
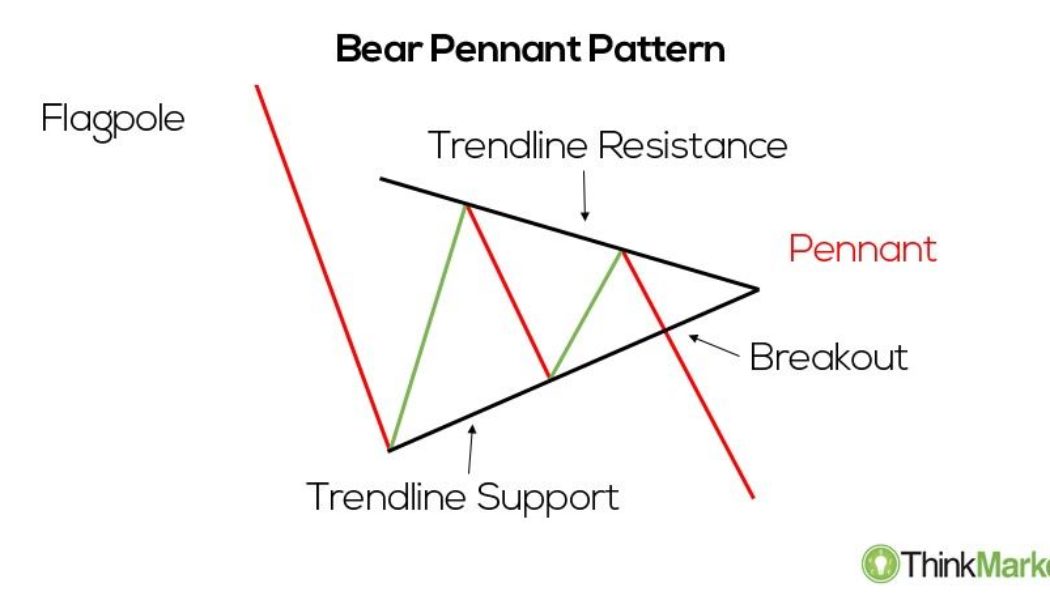

Spooky Solana breakdown begins with SOL price facing a potential 45% drop — Here’s why
Solana (SOL) dropped on May 26, continuing its decline from the previous day amid a broader retreat across the crypto market. SOL price pennant breakdown underway SOL price fell by over 13% to around $41.60, its lowest level in almost two weeks. Notably, the SOL/USD pair also broke out of what appears to be like a “bear pennant,” a classic technical pattern whose occurrences typically precede additional downside moves in a market. In detail, bear pennants appear when the price trades inside a range defined by a falling trendline resistance and rising trendline support. Bear pennant pattern. Source: ThinkMarkets These patterns resolve after the price breaks below the lower trendline, accompanied by higher volumes. As a rule of technical analysis, traders decide the pennant’...

The End of the Digital Gold Rush: How to Make Money on Bitcoin’s Collapse?
We use cookies on our website to give you the most relevant experience by remembering your preferences and repeat visits. By clicking “Accept All”, you consent to the use of ALL the cookies. However, you may visit “Cookie Settings” to provide a controlled consent.
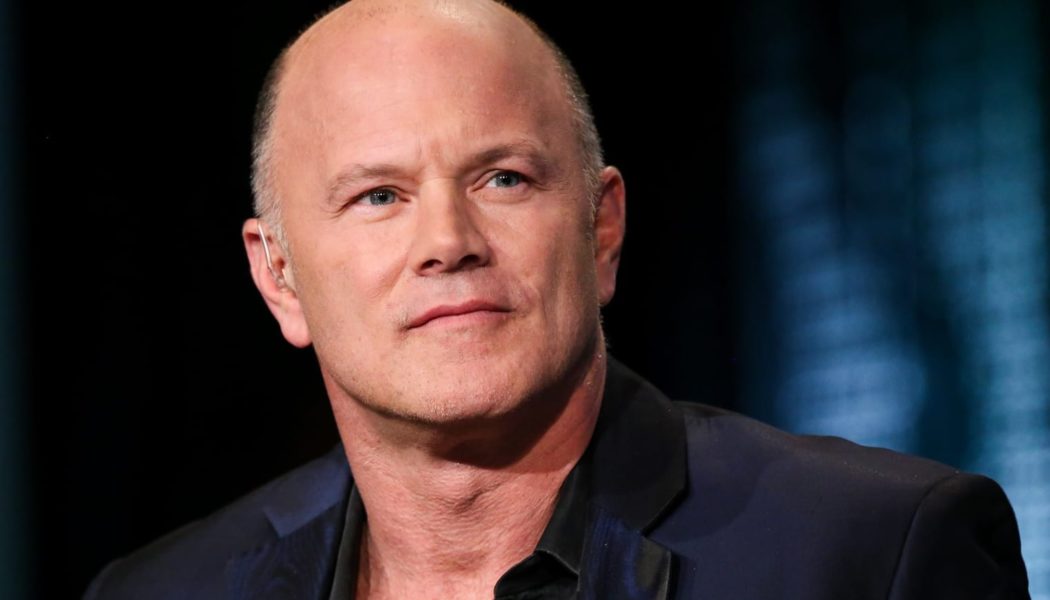

Galaxy Digital’s Novogratz finally clarifies the firm’s position following Terra crash
The Galaxy Digital CEO says the implosion is a reminder to investors to manage their risks He acknowledged that the algorithmic stable TerraUSD was a big idea that failed to live up to expectations The recent implosion of stable coin TerraUSD has demonstrated that cryptocurrencies still rank high among risk-on assets with extreme volatility. UST’s breakdown swept both retail traders and industry giants, and one CEO who’s felt the effects firsthand more than most is Galaxy Digital’s Mike Novogratz. The American investor was a recognised LUNA enthusiast before the breakdown of Terra, but he now says recent events are a reminder to remain humble in investments. Breaking a Twitter hiatus that lasted about ten days, Novogratz shared a link to a letter addressing the recent harrowing exper...

PLC Ultima, the new cryptocurrency that overtook bitcoin: Is it worth investing now, or is it too late?
In 2021, Bitcoin rose to its highest-ever price level, doing so amid a mega bull rally for the cryptocurrency market. The same year, a new coin hit the market and literally went on to overtake bitcoin. PLC Ultima (PLCU) is that cryptocurrency. It was launched at the end of December 2021, with PLCU’s value rising from $0.10 to $100,000 within six months. The coin’s value soared to highs of $116,000. Today, the price of PLCU is almost double that of Bitcoin. Now the big question: Is it still possible to earn on PLCU? Briefly below, we highlight some of the growth factors behind this project’s meteoric market performance. Infrastructure as a critical driver of cryptocurrency growth: how Alex Reinhardt created PLCU Coin Who created PLC Ultima? The creator of PLC Ultima is Alex Reinhardt, a ser...