The United States equities markets and the cryptocurrency markets had been rising leading up to the Sept. 13 release of the August consumer price index data, but the rally fell apart once the data showed inflation rising, rather than falling.
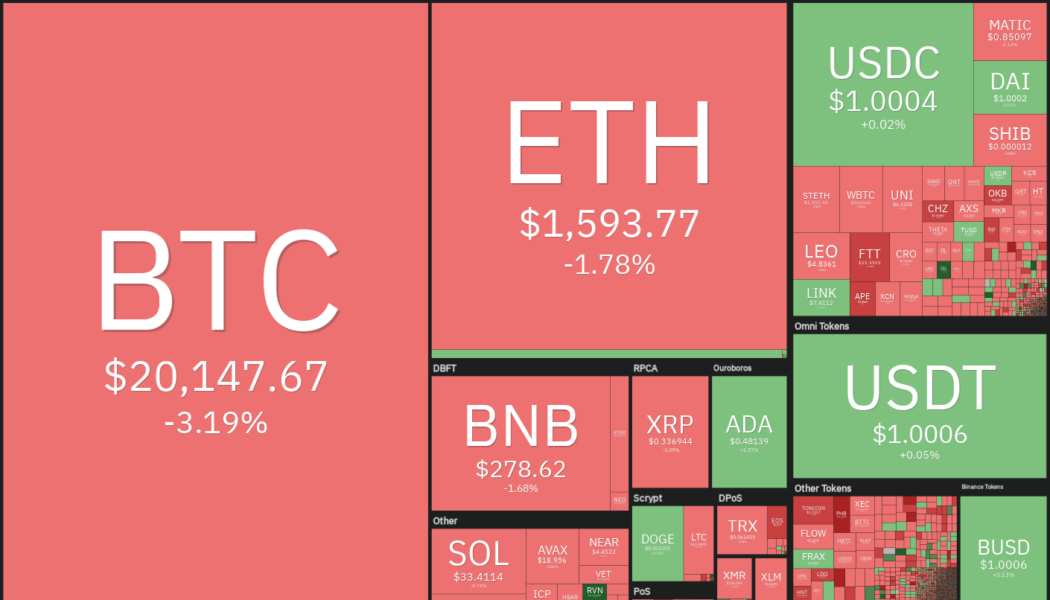
The negative data dashed any hope of a Federal Reserve pivot in the near term and it triggered a sharp decline in risky assets. The market capitalization of U.S. stocks plunged by about $1.6 trillion on Sept. 13 and the market cap of the cryptocurrency markets slipped below $1 trillion.

Statistician and independent market analyst Willy Woo, believes that Bitcoin (BTC) may have to fall further before it reaches the maximum pain experienced during previous bottoms. Woo expects Bitcoin price to decline below $10,000.
Could Bitcoin and altcoins resume their downtrend? Let’s study the charts of the top-10 cryptocurrencies to find out.
BTC/USDT
Bitcoin broke above the 50-day simple moving average ($21,902) on Sept. 12, but this proved to be a bull trap. Buyers attempted to extend the recovery on Sept. 13 but the rally reversed direction from $22,799.

Aggressive selling by the bears pulled the price back below the 20-day exponential moving average ($20,722). A minor positive is that the bulls are attempting to stall the decline at $20,000.
If buyers push the price back above the 20-day EMA, it will suggest that lower levels continue to attract buyers. The BTC/USDT pair will then attempt to rise to the 50-day SMA and later retest $22,799. A break and close above this resistance could open the doors for a possible rally to $25,211.
Contrary to this assumption, if the price slips below $19,860, the pair could drop to the $18,510 to $17,622 zone. The bulls are expected to defend this zone with vigor.
ETH/USDT
Ether (ETH) turned down and plummeted below the moving averages on Sept. 13, tilting the short-term advantage in favor of the bears. A minor positive is that the bulls are attempting to defend the support line of the rising wedge pattern.

If the price rebounds off the current level and rises above the moving averages, the ETH/USDT pair could rally to the resistance line of the wedge. The bulls will have to push and sustain the price above the wedge to clear the path for a possible rally to $2,030.
Alternatively, if the price fails to cross above the moving averages, the likelihood of a drop below the bearish wedge pattern increases. If that happens, the selling pressure could pick up and the pair could drop to $1,422 and later to $1,280. Buyers are expected to mount a strong defense at this level.
BNB/USDT
Binance Coin (BNB) turned down from $300 on Sept. 12 and plunged below the moving averages on Sept. 13. This tilted the short-term advantage in favor of the bears but the bulls have not yet given up.

Buyers are attempting to defend the immediate support at $275 and push the price above the 20-day EMA ($285). If they succeed, the BNB/USDT pair could challenge the $300 to $307.50 resistance zone. If buyers clear this zone, the rally could pick up momentum.
Conversely, if bulls fail to push the price above the 20-day EMA, it will suggest that bears are selling on minor rallies. That could enhance the prospects of a break below $275. If that happens, the pair could decline to $258 and then to $240.
XRP/USDT
After trading near the 50-day SMA ($0.35) for three days, XRP turned down and broke below the moving averages on Sept. 13. This pulled the price below the breakout level of $0.34.

Buyers are trying to push the price back above the 20-day EMA ($0.34) on Sept. 14. If they succeed, it will suggest that the XRP/USDT pair has formed a higher low at $0.33. The pair could then retest the overhead resistance at $0.36. A break and close above this level could push the pair toward $0.39.
Contrary to this assumption, if the price turns down from the 20-day EMA, it will suggest that bears are selling on minor rallies. That could pull the price down to the strong support at $0.32.
ADA/USDT
Cardano (ADA) rose above the 50-day SMA ($0.49) on Sept. 9 but the bulls could not continue the recovery and push the price to the downtrend line. This indicates hesitation by the bulls to buy at higher levels.

The failure to extend the recovery may have tempted short-term traders to book profits. That pulled the price back below the moving averages on Sept.13.
A minor positive is that the ADA/USDT pair rebounded off $0.46 and the bulls are attempting to push the price back above the moving averages. This indicates that lower levels continue to attract strong buying by the bulls. If the price rises above the 50-day SMA, the pair could reach the downtrend line.
This view will invalidate in the near term if the price turns down from the moving averages and plummets below $0.45. The pair could then decline to $0.42.
SOL/USDT
Buyers pushed Solana (SOL) above the 50-day SMA ($37.30) on Sept. 13 and Sept. 14 but the bulls could not sustain the higher levels. This shows that bears are defending the 50-day SMA with vigor.

Strong selling on Sept. 13 pulled the price below the 20-day EMA ($34). The bears will now try to sink the SOL/USDT pair to the immediate support at $30. The repeated retest of a support level tends to weaken it. If the $30 level cracks, the pair could start its descent to the vital support at $26.
Contrary to this assumption, if the price turns up from the current level and breaks above the 20-day EMA, the pair could rise to the 50-day SMA. The bulls will have to clear this overhead hurdle to indicate the start of an up-move to $48.
DOGE/USDT
Dogecoin (DOGE) bounced off the support zone near $0.06 on Sept. 7 but the recovery fizzled out at the 20-day EMA ($0.06). This indicates that bears are defending the moving averages aggressively.

The price turned down from the 20-day EMA on Sept. 13 and reached the support at $0.06. The bulls are expected to defend the level aggressively as a break and close below it could sink the DOGE/USDT pair to the June low at $0.05. If this support cracks, it could signal the resumption of the downtrend.
This negative view could invalidate if the price rebounds off the current level and rises above the moving averages. If that happens, the pair could attempt a rally to $0.09.
Related: Ethereum’s Merge will affect more than just its blockchain
DOT/USDT
Polkadot (DOT) repeatedly tried to rise and sustain above the 50-day SMA ($7.90) from Sept. 9-13 but the bears held their ground. This indicates that the sentiment remains negative and bears are selling on rallies to resistance levels.

The failure to rise above the 50-day SMA may have attracted strong selling by the bears and profit-booking by the short-term bulls. That pulled the price back below the 20-day EMA ($7.43) on Sept. 13. The bears will now attempt to sink the DOT/USDT pair below the immediate support at $6.75 and challenge the crucial level at $6.
Alternatively, if the price rebounds off the current level and rises above the 20-day EMA, it will suggest that bulls continue to buy on dips. The bulls will then again try to overcome the barrier at the 50-day SMA and start a rally toward $10.
MATIC/USDT
Polygon (MATIC) has been stuck inside a large range between $0.75 and $1.05 for the past several weeks. Both moving averages have flattened out and the relative strength index is near the midpoint, indicating a balance between buyers and sellers.

The MATIC/USDT pair has been attempting to rise inside an ascending channel for the past few days. If the price plummets below the channel, it will signal a minor advantage to the bears. The pair could then decline to the strong support at $0.75.
Contrary to this assumption, if the price rebounds off the current level and rises above the moving averages, the pair could reach the resistance line of the channel. A break and close above the channel could open the doors for a possible rally to $1.05.
SHIB/USDT
Shiba Inu (SHIB) managed to stay above the moving averages between Sept. 9-12 but the bulls could not build upon this strength and clear the overhead hurdle at the downtrend line. This indicates a lack of demand at higher levels.

The price plunged back below the moving averages on Sept. 13 and the bears will now attempt to pull the SHIB/USDT pair below the strong support at $0.000012. If they succeed, the pair will complete a descending triangle pattern. This bearish setup has a target objective of $0.000009.
Contrary to this assumption, if the price rebounds off the current level and breaks above the moving averages, the pair could reach the downtrend line. A break and close above this level will invalidate the bearish setup and clear the path for a rally to $0.000018.
The views and opinions expressed here are solely those of the author and do not necessarily reflect the views of Cointelegraph. Every investment and trading move involves risk. You should conduct your own research when making a decision.
Market data is provided by HitBTC exchange.
 [flexi-common-toolbar] [flexi-form class=”flexi_form_style” title=”Submit to Flexi” name=”my_form” ajax=”true”][flexi-form-tag type=”post_title” class=”fl-input” title=”Title” value=”” required=”true”][flexi-form-tag type=”category” title=”Select category”][flexi-form-tag type=”tag” title=”Insert tag”][flexi-form-tag type=”article” class=”fl-textarea” title=”Description” ][flexi-form-tag type=”file” title=”Select file” required=”true”][flexi-form-tag type=”submit” name=”submit” value=”Submit Now”] [/flexi-form]


Tagged: Binance Coin, Bitcoin, Cardano, crypto blog, Crypto news, Dogecoin, Ethereum, Markets, Polkadot, polygon, Price analysis, Ripple, Shiba Inu, Solana