This crypto winter wasn’t a very long one. Having briefly touched $34,000 in the second half of January, Bitcoin (BTC) is on its way up again, touching the $45,000 mark on Feb. 10. Many altcoins have been catching up as well and posting double-digit weekly returns. However, not all relief rallies were equally impressive. Is there a way for traders to pick the assets that are about to pull off the strongest rebounds?
Luckily, bullish marketwide reversals tend to look similar in terms of both price movement and other variables that shape market activity: rising trading volumes, spikes of online attention to individual tokens, and the elevated sentiment of social media chatter around them. Furthermore, the conditions that underlie individual assets’ rallies in a resurging crypto market often recur as well.
What this means in practice is that automated data intelligence tools capable of detecting similarities between past and present trading conditions around crypto assets — such as the VORTECS™ Score, available to subscribers of Cointelegraph Markets Pro — can be especially efficient in alerting traders to impending price spikes when the market flips bullish.
Bullish confidence
The basic principle behind the VORTECS™ Score is a comparison between the asset’s trading conditions right now and those in the past. The algorithm constantly sifts through years’ worth of each digital asset’s historical data on price movement, trading volumes, and Twitter activity and social sentiment, seeking to identify combinations of these metrics that in the past regularly showed up before huge price pumps.
The result is a Score that ranges between 0 and 100. Scores of 80 and above indicate historical outlooks that are bullish for roughly the next 10 to 72 hours. If a coin hits 90 or goes even higher, it means that the model is highly confident that it observes a pattern that consistently preceded past upsides.
In a normal week, there will be an average of three to four instances of a VORTECS™ Score of 90 or above. But with the crypto market recovering, we saw 10 such cases from Feb. 3 to 10. On average, the assets that achieved a Score of 90 added 7% of value 24 hours after hitting the 90-VORTECS™ threshold and gained 15% after 72 hours. Here are the most impressive cases.
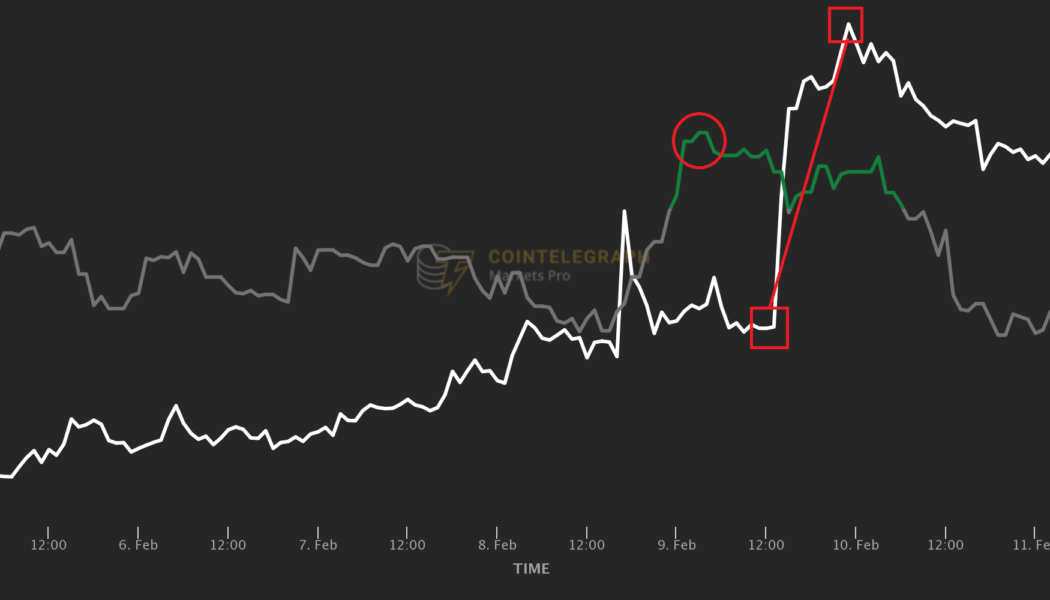
KEEP: A weekly return of +58.64% after a VORTECS™ Score of 92

The price of Keep Network’s KEEP token had been steadily rising in the first half of the week, largely mirroring the market’s overall favorable trend and going from $0.46 on Feb. 5 to $0.58 on Feb. 8. Then, suddenly, a combination of historical trading conditions around the token started to look extremely bullish, as evidenced by a peak VORTECS™ Score of 92 (red circle in the chart). Nine hours after the peak Score, KEEP’s price skyrocketed, soaring from $0.57 to $0.76 in 10 hours.
MNW: A weekly return of +54.63% after a VORTECS™ Score of 90

MNW, the utility token of supply chain management-focused Morpheus.Network, has sported robust fundamentals since mid-January when the protocol saw a smart contract upgrade and new masternodes integrated into the network. This past week, indications of strong trading conditions preceded both phases of MNW’s rally. The more powerful second phase came 12 hours after the asset flashed an ultra-robust historical outlook, reaching a VORTECS™ Score of 90 on Feb. 6. A subsequent price pump saw MNW hike from $1.33 to $1.72.
LEO: A weekly return of +52.56% after a VORTECS™ Score of 91

Unus Sed Leo (LEO), an asset tied to crypto exchange Bitfinex, experienced massive upside pressure this week when the news emerged that the United States Department of Justice had recovered some 80% of Bitcoin stolen from the platform in a 2016 hack. The volume and sentiment of the online discussion have clearly shaped what the VORTECS™ algorithm recognized as extremely favorable trading conditions, marked by a Score of 91 that lit up in the early hours of Feb. 7. Less than two days later, LEO’s price spiked from below $5 to $7.53 within a few hours.
As a famous saying goes, history does not repeat itself, but it often rhymes. Even the most favorable historical precedent is not a guarantee of future price action, but incorporating automated analysis of crypto assets’ past performance data into a trading strategy can hugely improve its performance.
Cointelegraph is a publisher of financial information, not an investment adviser. We do not provide personalized or individualized investment advice. Cryptocurrencies are volatile investments and carry significant risk including the risk of permanent and total loss. Past performance is not indicative of future results. Figures and charts are correct at the time of writing or as otherwise specified. Live-tested strategies are not recommendations. Consult your financial adviser before making financial decisions.
 [flexi-common-toolbar] [flexi-form class=”flexi_form_style” title=”Submit to Flexi” name=”my_form” ajax=”true”][flexi-form-tag type=”post_title” class=”fl-input” title=”Title” value=”” required=”true”][flexi-form-tag type=”category” title=”Select category”][flexi-form-tag type=”tag” title=”Insert tag”][flexi-form-tag type=”article” class=”fl-textarea” title=”Description” ][flexi-form-tag type=”file” title=”Select file” required=”true”][flexi-form-tag type=”submit” name=”submit” value=”Submit Now”] [/flexi-form]


Tagged: Altcoin Watch, crypto blog, Crypto news, cryptocurrencies, CryptoMarket, Market Analysis, Markets, Markets Pro, Trading